

Discrimination of drugs and explosives in cargo inspections byapplyingmachine learningin muon tomography
-
Abstract: A previously under-explored difficulty in cargo inspections is how to efficiently detect drugs and explosives concealed in large dense metals.Cosmic ray muon tomography is a promising non-destructive imaging technique to solve the problem because muons are naturally generated in the atmosphere and have sufficient energy to completely penetrate large dense containers.In this work it is investigated that to what extent drugs and explosives of a certain size could be discriminated from air background and metals by muon tomography within acceptable measuring time.A Geant4 Monte Carlo simulation is built based on the Tsinghua University MUon Tomography facility (TUMUTY) and a support vector machine (SVM) classifier based on machine learning is trained to differentiate drugs and explosives from air background and metals automatically.For various 20 cm×20 cm×20 cm objects, with 10 min to 30 min measuring time, drugs and explosives could be discriminated from background and metals by muon tomography with an error rate of about 1%.With 1 min, the error rate deteriorates to 12.9%.
-
Key words:
- muon tomography /
- scattering density /
- drugs and explosives /
- machine learning
摘要: 在集装箱安检中一个很重要的亟待解决的问题是如何有效地检测出藏在金属中的毒品和爆炸物。传统的X射线CT难以穿透较厚的金属材料,而中子CT引入了很大的放射性,其屏蔽问题是一个难点。相较之下,宇宙线缪子成像是一种有前景的非破坏性成像技术,因为缪子来源于天然的宇宙射线且有足够的能量完全穿透大型集装箱。本文研究了在可接受的测量时间内,宇宙线缪子成像方法能够在何种程度上识别毒品爆炸物与空气和金属。基于清华大学缪子实验平台TUMUTY并通过Geant4模拟宇宙线缪子与物质的相互作用,毒品爆炸物及不同金属材料的散射密度能够被重建出来。基于模式识别的SVM分类器被训练出来对这些材料进行自动识别分类。结果显示,对于边长为20 cm的不同材料的物块,在10到30 min的测量时间内,能够通过缪子成像方法识别毒品爆炸物与金属材料和本底,分类的错误率约为1%;测量时间为1 min时,分类的错误率恶化为12.9%。 -
Smuggling drugs and explosives is a major concern at customs or ports, and thus it requires more effective and sensitive techniques to discriminate drugs and explosives in cargo inspections[1]. Conventionally, X-ray CT is used to differentiate drugs and explosives based on the density and mass attenuation coefficient[2]. Using fast/thermal neutrons can induce the radiative capture gamma-rays to discern the chlorine element presented in drugs[3]. However, both techniques introduce extra radiative sources with a necessary concern over radiation protection, and they may become invalid if drugs or explosives are concealed within large dense metals which X-rays or neutrons couldn't penetrate[4].
Cosmic ray muon tomography is a promising non-destructive imaging technique by measuring the scattering property of muons[5]. Contrary to X-ray CT and neutrons, muons are naturally generated in the atmosphere and have sufficient energy to penetrate thick containers. The flux rate of muons is about 1 cm-2· min-1 at sea level [6]. Previous studies have investigated that muon tomography is sensitive to detect high-Z nuclear materials including uranium, tungsten and lead, and they mainly focus on differentiating high-Z materials within a short time in real applications for cargo inspection[4, 7]. If muon tomography could be further applied to discern medium-Z and low-Z materials, it will shed light on the previously under-explored difficulty of detecting drugs and explosives concealed in large scale metals like steel or copper. The Decision Sciences International Corporation (DSIC) has proposed a stopping to scattering ratio to characterize low-Z materials by adding the stopping information of cosmic ray electrons to muon scattering tomography[8]. However, the ratio value could not be voxelized, resulting in inconvenience in real applications; and the potential of detecting drugs and explosives by applying only muon scattering tomography requires further research.
The purpose of this work is to investigate to what extent drugs and explosives of a certain size could be discriminated from air background and metals within acceptable measuring time by cosmic ray muon tomography. A Geant4 Monte Carlo simulation is built based on the Tsinghua University MUon Tomography facilitY (TUMUTY) and only muon scattering information is examined for various materials. A support vector machine (SVM) classifier based on machine learning is trained to differentiate various materials automatically. The principle of muon tomography and the simulation setup are described in Sect.1. The results are reviewed in Sect.2 and the summary is drawn in Sect.3.
1. Materials and methods
The principle of muon tomography lies on multi Coulomb scattering[6], that is, muons passing through materials undergo inelastic collisions with nuclei and get deflected by a cumulation of multiple small scattering angles[5-6]. According to the Molière theory, the scattering angle approximately obeys the Gaussian distribution and the root mean square of the scattering angle is given by[6]
σθ=13.6MeVβcpe√xX0(1+0.038lnxX0) (1) where p, βc and e are the momentum, speed and charge of muons respectively (c is light speed, the unit of p is MeV/c), x is the path length of muons in materials, and X0 is the radiation length given by[6]
X0=(716.4g⋅cm−2)AZ(Z+1)ln(287/√Z) (2) where Z and A are the atomic number and the mass number of a material. Since the speed of muons is very close to the speed of light, the value of β is approximately 1. The charge of muons is 1 or -1 and the value of 0.038ln(x/X0) in Eq.(1) is usually far less than 1. Thus Eq.(1) could be simplified to
σθ=13.6p√xX0 (3) To eliminate the dependence of scattering angle on material thicknesses, the scattering density is defined as Eq.(4)[6], which is only related to the atomic number and the mass number of a material, and the momentum of muons. Thus various materials could be determined by the scattering density. The scattering density is the σθ2 divided by the thickness x, and thus it has a unit of mrad2·cm-1.
λ=σ2θx=(13.6p)21X0 (4) A Geant4 Monte Carlo simulation is built based on TUMUTY as shown in Fig. 1[9]. It has 6 layers of multi-gap resistive plate chamber (MRPC) detectors with an efficient area of 73.6 cm×73.6 cm and a detection efficiency of greater than 90% in reality[9]. In the simulation, the detection efficiency of each detector is assumed to be 100%. The simulation setup is shown in Fig. 2. Six objects with the dimension 20 cm×20 cm×20 cm, including heroin, TNT, Al, Fe, Cu and Pb, are placed in the center layer of the geometry. Because of the limited efficient area of the detector, 2 of the 6 objects are placed each time with a center distance of 50 cm. 20 cm×20 cm×20 cm air located at the center of the 2 objects is taken as background (Bg). The muon source is generated from CRY[10] and impinges on an area of 100 cm×50 cm. In the simulation we assume muons are generated in the central layer and check whether the muon track could be recorded by the detector. Thus the measuring time could be easily calculated and the computing efficiency could be improved. The impinging area of muons is selected as possibly small to improve the computing efficiency but at the same time to make sure all the objects are not close to the boundary. Here we select a rectangular area since the two objects are placed side by side. Given that the muon flux rate is about 1 cm-2·min-1 at sea level[6], when 5×10⁶, 5×10⁴ and 5×10³ muons are emitted to the area, they correspond to 16.7 h, 10 min and 1 min measuring time respectively. We use the standard physics list for high energy particles "FTFP_BERT" in Geant4, which contains all the cross sections for muons' electromagnetic processes, including muon ionization, bremsstrahlung, pair production, Coulomb scattering and multi scattering process. The interaction between muons and materials results in a loss of energy and scattering by the potential of nuclei and electrons at the same time. For cargo inspections, muons interact with other materials mainly by multi scattering and almost all muons can get through the objects regardless of the compositions and densities. When muons penetrate the objects and get scattered, the incoming and outgoing muon tracks are measured and the scattering density in Eq.(4) is reconstructed by the Point of the Closest Approach (PoCA) algorithm[4], with a reconstructed region of 100 cm×50 cm×50 cm. To differentiate various materials automatically, an SVM classifier implanted in MATLAB is trained for material classification, which is a supervised learning model in machine learning[10]. To train the classifier, scattering densities are taken as the measurement data and the mean and the standard deviation of scattering density are extracted as features for classification. For each object, 1000 times independent simulations are conducted with 10 min and 1 min measuring time respectively. For each simulation, the scattering density distributions of the 6 objects and the background are obtained by making a histogram of the scattering density in the corresponding regions. After discarding the scattering density which is less than 0.1 mrad2·cm-1 and larger than 500 mrad2·cm-1 to reduce noises, the mean and the standard deviation of the scattering density are calculated for each object in each simulation. By the whitening transformation of the mean and the standard deviation[11], various materials could be classified to the corresponding types by the SVM classifier with a polynomial kernel function[11]. The whitening transformation is a common linear transforming method used in machine learning[11]. It transforms a vector of random variables into a set of new variables whose covariance is uncorrelated with a variance of 1. Here the mean vector and the standard deviation vector are divided by their corresponding variance to be decorrelated. The mean error rate for classification is obtained by the 2-fold cross-validation method[11].
 Figure 1. Geometry of TUMUTY
 Figure 2. Simulation setup
2. Results and discussion
When the objects are heroin and Fe (see Fig. 2) and the measuring time is 16.7 h and 10 min respectively, the spatial scattering density is shown in Fig. 3. With a longer measuring time like 16.7 h, the position and shape of heroin and Fe could be obtained by muon tomography with a spatial resolution of 1 cm (see Fig. 3(a)). However, in real applications, it requires to scan the container within a shorter time like less than 10 min. In Fig. 3(b), it's difficult to discern heroin and Fe in 10 min directly because statistical fluctuations dominate with insufficient muon incidents. Thus it's necessary to train a classifier to differentiate various materials automatically based on the scattering density.
 Figure 3. Spatial scattering density of heroin (left) and Fe (right). The scattering density is defined in Eq.(4), which is the σθ2 divided by the thickness x, and thus it has a unit of mrad2·cm-1
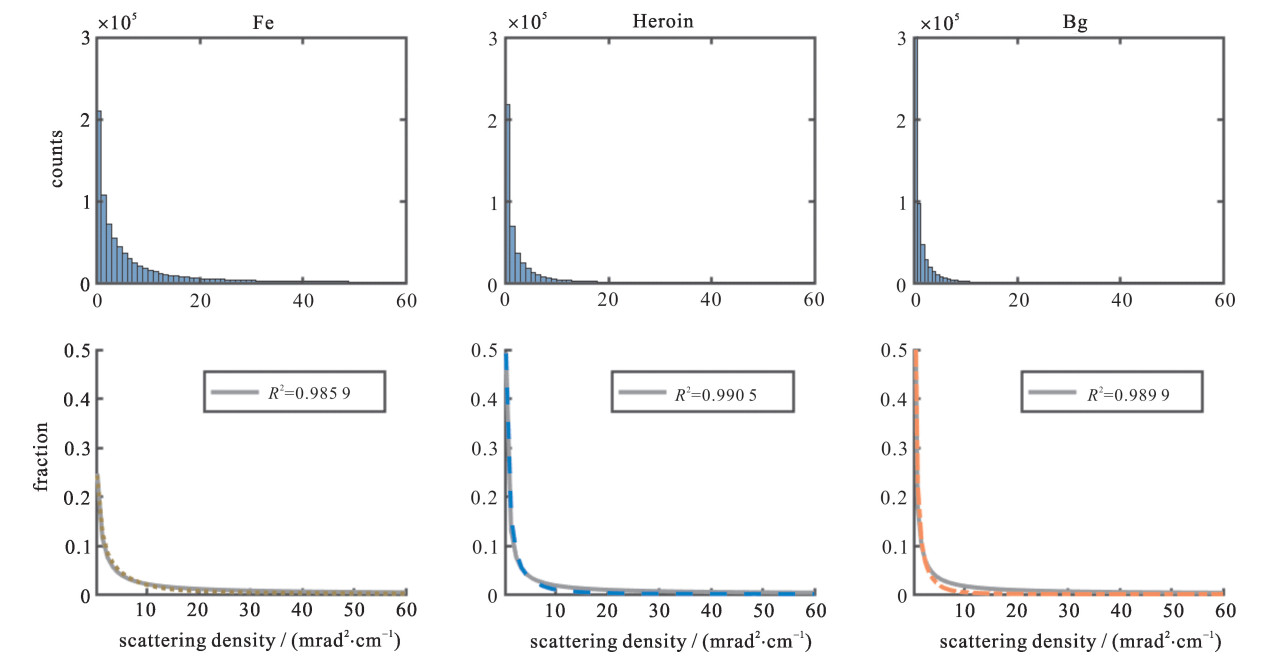
For the 1000 times independent simulations with 10 min measuring time each, the scattering density distributions for heroin, Fe and background are shown in Fig. 4 and are normalized by each plot area to get the corresponding probability density distributions. Then the density distribution is fitted by a simple rational function, f(x)=px+q, where p and q are fitting parameters (see Fig. 4). The principle of muon tomography lies on multi Coulomb scattering[6] and the scattering density is an important parameter to reflect the scattering properties. Previous studies have not shown the scattering density distributions of various materials. Fig. 4 demonstrates that various materials have a similar scattering density distribution, which could be simply fitted by a rational function. Although in Fig. 3(b) heroin and Fe couldn't be discerned directly with 10 min measuring time, their scattering density distributions in Fig. 4 could be used for material discrimination. Because of the robustness of fitting the density distribution by the rational function (see Fig. 4), it is implied that only two parameters, p and q, are sufficient and efficient to reflect the scattering information. As for material discrimination, one method is to use p and q as features; and the other is to extract two parameters from the scattering density distribution to serve as classifying features. Here the mean and the standard deviation of scattering density are selected and used as the features for training classifiers because it's much easier to accumulate big data of the mean and the standard deviation. Using p and q for training classifiers requires further studies.
 Figure 4. Scattering density distributions for heroin, Fe and background. The upper row is the result of 1000 times independent simulations with 10 min measuring time. The lower row is the corresponding probability density distribution, fitted by the simple rational function of f(x)=px+q
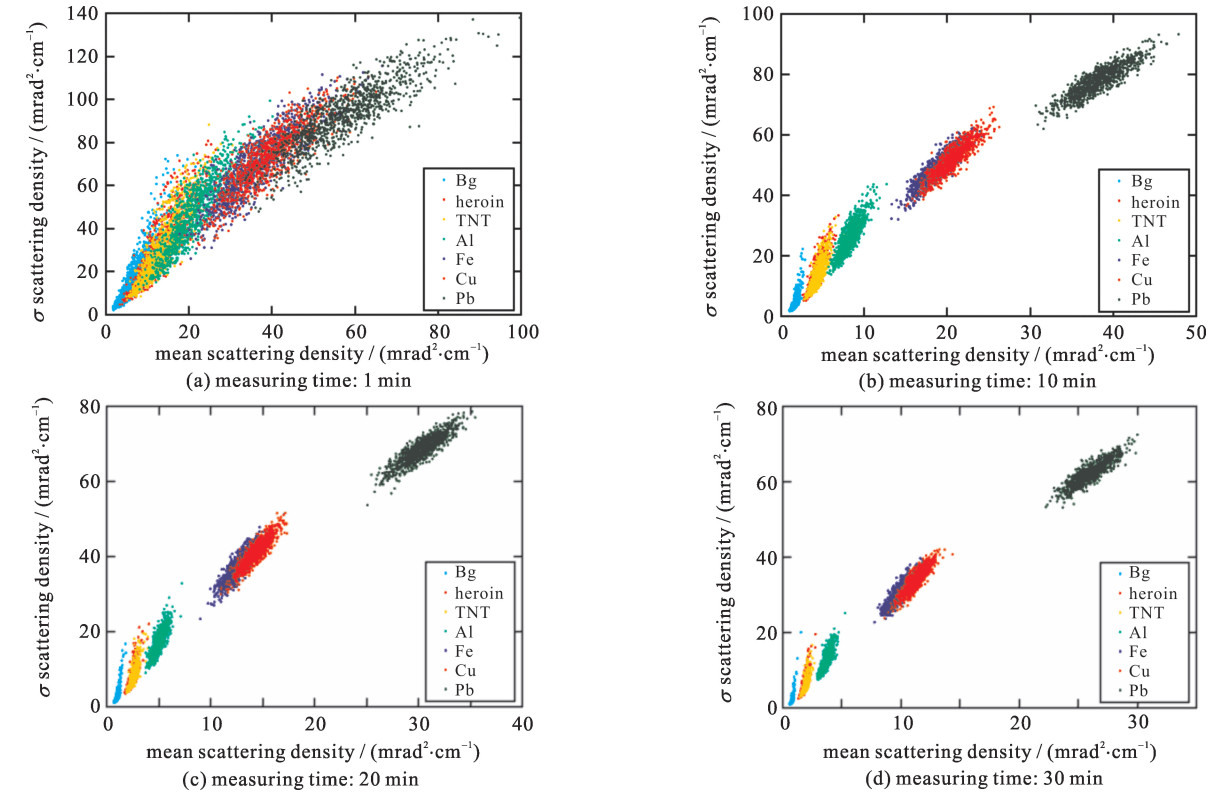
The mean and the standard deviation of scattering density for 20 cm×20 cm×20 cm heroin, TNT, Al, Fe, Cu, Pb and background are shown in Fig. 5, with 1000 times independent simulations for each object and with 30 min, 20 min, 10 min and 1 min measuring time respectively. Based on Fig. 5, the SVM classifiers are shown in Fig. 6 with the mean error rate for misclassification in Table 1. Due to the limitations of the PoCA algorithm, the central points for various materials are not the same in Fig. 5 but the displacement of the central points decreases in Fig. 6 after the whitening transformation. This method may lead to misclassification. In this way, drugs and explosives could be differentiated from background and metals. The mean error rate is about 1% with 10 min to 30 min, and 12.9% with 1 min measuring time. In Figs. 6(b), (c) and (d), with 10 min to 30 min, 6 types of materials could be characterized, including background, low-Z non-metallic materials factoring in drugs and explosives, low-Z metals factoring in Al, medium-Z materials factoring in Fe, medium-Z metals factoring in Cu, and high-Z metals factoring in Pb. In Fig. 6(a), with 1 min, 5 types of materials could be characterized, including background, low-Z non-metallic materials factoring in drugs and explosives, low-Z metals factoring in Al, medium-Z metals factoring in Fe and Cu, and high-Z metals factoring in Pb.
 Figure 5. Mean and standard deviations of scattering density for background, heroin, TNT, Al, Fe, Cu and Pb. For each object, 1000 times independent simulations are conducted
 Figure 6. Classification results by training SVM classifiers based on Fig. 5. After whitening transformation (here the mean vector and the standard deviation vector are divided by its corresponding variance to be decorrelated), the mean and the standard deviations of scattering density in Fig. 5 become the relative mean and the relative standard deviationsTable 1. Error rate for misclassification by means of 2-fold cross-validation. With 10 min to 30 min, Fe and Cu are classified as 2 types of materials. But with 1 min, Fe and Cu couldn't be differentiated and are regarded as one type of material
measuring time/min mean error rate/% Bg heroin & TNT Al Fe Cu Pb 30 0 1.3 0 3.3 3.2 0 20 0 1.1 0.1 4.0 4.1 0 10 0 1.3 0.2 6.0 5.7 0 1 6.3 12.9 8.0 5.6(Fe & Cu) 3.5 | Show Table DownLoad:
CSV
DownLoad:
CSV
In the current research, all objects are placed side by side.We have examined the cases when the objects are placed vertically suspended, and the classifiers degrade. If the objects have complicated shapes and are nested placed, the misclassification rate deteriorates and then it may require longer measuring time to train the classifier. When the objects have a larger size or a smaller size, within the same measuring time, the number of muons interacting with the objects will also be larger or smaller. Thus the misclassification rate will change. For example, when the cube length is enlarged by √10 times, the misclassification rate for 1 min measuring time could be decreased to that for 10 min measuring time; and when the cube length is enlarged by √20 or √30 times, the error rate for 10 min is reduced a little but is almost the same. Therefore, if the objects are of different sizes, it is still possible to train the classifier since the scattering density in Eq.(4) is independent of the shape and size of the objects. But it requires longer measuring time to get stable reconstructed scattering densities by the PoCA algorithm. If the average energy of muons decreases to about 1 GeV, it will benefit the classification because the differences between scattering densities for various materials become larger based on Eq.(4).
3. Conclusion
In this work, a Geant4 Monte Carlo simulation is built based on TUMUTY and an SVM classifier is trained to discriminate drugs and explosives from background and metals automatically. For various 20 cm×20 cm×20 cm objects, with 10 min to 30 min measuring time, drugs and explosives could be discerned from background and metals by muon tomography with an error rate of about 1%. With 1 min, the error rate deteriorates to 12.9%.
-

Figure 3. Spatial scattering density of heroin (left) and Fe (right). The scattering density is defined in Eq.(4), which is the σθ2 divided by the thickness x, and thus it has a unit of mrad2·cm-1

Figure 4. Scattering density distributions for heroin, Fe and background. The upper row is the result of 1000 times independent simulations with 10 min measuring time. The lower row is the corresponding probability density distribution, fitted by the simple rational function of f(x)=px+q

Figure 5. Mean and standard deviations of scattering density for background, heroin, TNT, Al, Fe, Cu and Pb. For each object, 1000 times independent simulations are conducted
Figure 6. Classification results by training SVM classifiers based on Fig. 5. After whitening transformation (here the mean vector and the standard deviation vector are divided by its corresponding variance to be decorrelated), the mean and the standard deviations of scattering density in Fig. 5 become the relative mean and the relative standard deviations
Table 1. Error rate for misclassification by means of 2-fold cross-validation. With 10 min to 30 min, Fe and Cu are classified as 2 types of materials. But with 1 min, Fe and Cu couldn't be differentiated and are regarded as one type of material
measuring time/min mean error rate/% Bg heroin & TNT Al Fe Cu Pb 30 0 1.3 0 3.3 3.2 0 20 0 1.1 0.1 4.0 4.1 0 10 0 1.3 0.2 6.0 5.7 0 1 6.3 12.9 8.0 5.6(Fe & Cu) 3.5  下载: 导出CSV
-
[1] Decker S H, Chapman M T. Drug smugglers on drug smuggling: Lessons from the inside[M]. Pennsylvania: Temple University Press, 2008. [2] Zentai G. X-ray imaging for homeland security[J]. International Journal of Signal and Imaging Systems Engineering, 2010, 3(1): 13-20. doi: 10.1504/IJSISE.2010.034628 [3] Kiraly B, Olah L, Csikai J. Neutron-based techniques for detection of explosives and drugs[J]. Radiation Physics and Chemistry, 2001, 61(3/6): 781-784. [4] Procureur S. Muon imaging: Principles, technologies and applications[J]. Nuclear Instruments and Methods in Physics Research Section A: Accelerators, Spectrometers, Detectors and Associated Equipment, 2018, 878: 169-179. [5] Chatzidakis S, Choi C K, Tsoukalas L H. Interaction of cosmic ray muons with spent nuclear fuel dry casks and determination of lower detection limit[J]. Nuclear Instruments and Methods in Physics Research Section A: Accelerators, Spectrometers, Detectors and Associated Equipment, 2016, 828: 37-45. [6] Rossi B B. High-energy particles[M]. New York: Prentice-Hall, 1965. [7] He W, Xiao S, Shuai M, et al. A grey incidence algorithm to detect high-Z material using cosmic ray muons[J]. Journal of Instrumentation, 2017, 12(10): P10019. doi: 10.1088/1748-0221/12/10/P10019 [8] Blanpied G, Kumar S, Dorroh D, et al. Material discrimination using scattering and stopping of cosmic ray muons and electrons: Differentiating heavier from lighter metals as well as low-atomic weight materials[J]. Nuclear Instruments and Methods in Physics Research Section A: Accelerators, Spectrometers, Detectors and Associated Equipment, 2015, 784: 352-358. doi: 10.1016/j.nima.2014.11.027 [9] Wang X, Zeng M, Zeng Z, et al. The cosmic ray muon tomography facility based on large scale MRPC detectors[J]. Nuclear Instruments and Methods in Physics Research Section A: Accelerators, Spectrometers, Detectors and Associated Equipment, 2015, 784: 390-393. doi: 10.1016/j.nima.2015.01.024 [10] Hagmann C, Lange D, Wright D. Cosmic-ray shower generator (CRY) for Monte Carlo transport codes[C]//Nuclear Science Symposium Conference Record. 2007, 2: 1143-1146. [11] Nasrabadi N M. Pattern recognition and machine learning[J]. Journal of Electronic Imaging, 2007, 16: 049901. doi: 10.1117/1.2819119 期刊类型引用(5)
1. 姚凯强,苏宝鹏,李卓岱,刘国睿,李江坤,刘军涛,刘志毅. 宇宙射线缪子成像技术在中国的研究进展. 中国无机分析化学. 2024(06): 715-731 .  百度学术
百度学术2. 李笑梅,智宇,李沛玉,胡守扬,王义,刘树彬,李奇特,汤秀章,韩然,欧阳晓平,刘志毅,唐健,胡坤,王晓冬,文群刚,樊瑞睿,赵保真,赵永刚,韩冬,刘大铭,叶邦角,封常青,沈仲弢,潘子文,王宇,陈欣南,高春宇,李雨芃,周静,贾世海,宋金兴,孙鹏飞,赵明锐,吝守龙,邓桂华,卢志永,许天驹,庄晓,王浩桢,蒋涛,李志伟,李景太,冒鑫,刘军涛,李卓岱,刘国睿,罗旭佳,姚凯强,罗思远,罗凤姣,何列,肖万成,田宝贤,吕学升,沈彦,黄声慧,陈雷,靳尚泰,郭佳承. 缪子成像技术及其研究现状与发展趋势. 原子能科学技术. 2023(07): 1281-1311 . 百度学术3. 熊凯,魏春岭,周鹏. 基于宇宙线缪子探测的水下定位方法研究. 战术导弹技术. 2023(04): 56-68 . 百度学术4. 钱祎剑,张立军,陈灵新,王冠鹰. 宇宙射线缪子核材料快速检测算法研究. 原子能科学技术. 2021(12): 2339-2345 . 百度学术5. Xing-Yu Pan,Yi-Fan Zheng,Zhi Zeng,Xue-Wu Wang,Jian-Ping Cheng. Experimental validation of material discrimination ability of muon scattering tomography at the TUMUTY facility. Nuclear Science and Techniques. 2019(08): 60-68 . 必应学术其他类型引用(5)
-

 DownLoad:


 点击查看大图

计量
- 文章访问数: 2296
- HTML全文浏览量: 547
- PDF下载量: 185
- 被引次数: 10
