

Research progress on loading capability of high-power solid-state laser facilities
-
摘要:
高功率固体激光装置的负载问题是制约装置建设与运行的瓶颈问题。在高通量紫外纳秒激光辐照下,熔石英后表面的损伤不断产生和增长,严重限制了装置的负载能力。在提升熔石英抗损伤性能的基础上修复既有损伤,循环使用光学元件,是现阶段提升装置负载能力的主要手段。主要介绍了国内外近年来在熔石英损伤的规律与机制、光学元件循环处理的支撑技术以及提升负载能力的新材料与新技术方面所取得的重要进展。
Abstract:The loading capability is a bottle-neck challenge in both the construction and operation of high-power laser facilities. Under high-fluence, nanosecond laser irradiation in the ultraviolet regime, damage sites are constantly witnessed initiating and growing on the rear surface of fused silica, severely limiting the loading capability of high-power lasers. Optics recycling which is based on improving the damage resistance of fused silica and mitigating the as-grown damage sites is currently the major strategy for improving the loading capability. This paper introduces the recent progress in the laws and mechanism of laser-induced damage in fused silica, the essential techniques supporting the optical recycling strategy and the new materials and techniques developed to improve the loading capability of high-power laser facilities.
-
Key words:
- high-power laser facility /
- fused silica /
- laser-induced damage /
- chemical etching /
- damage mitigation
-
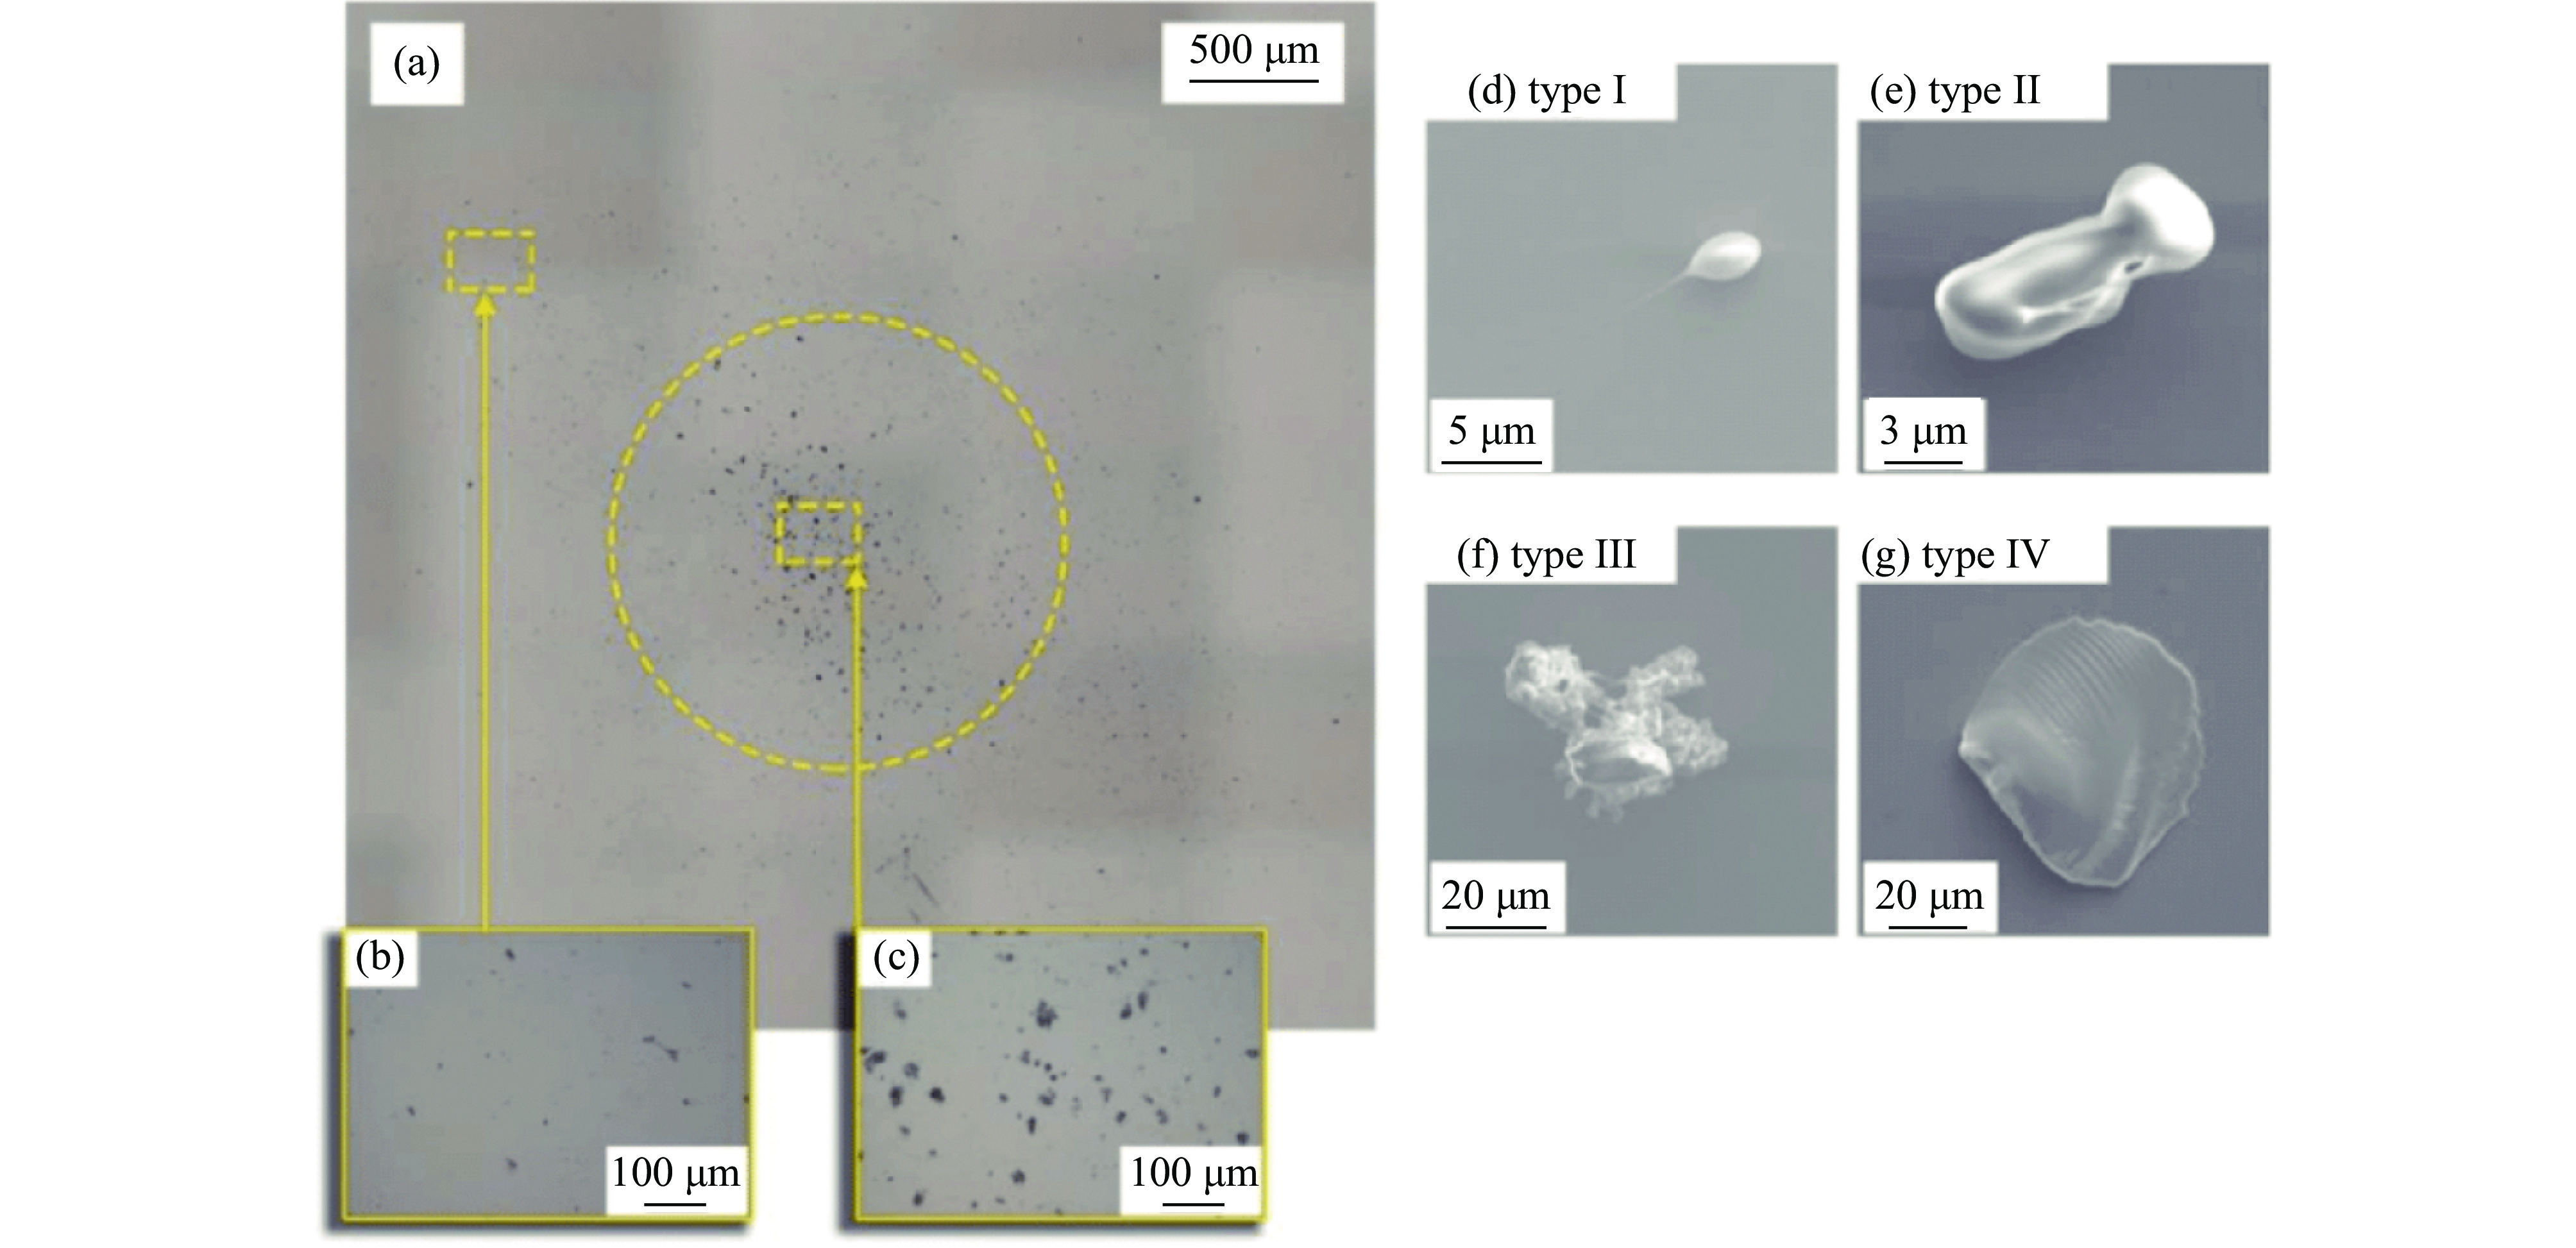
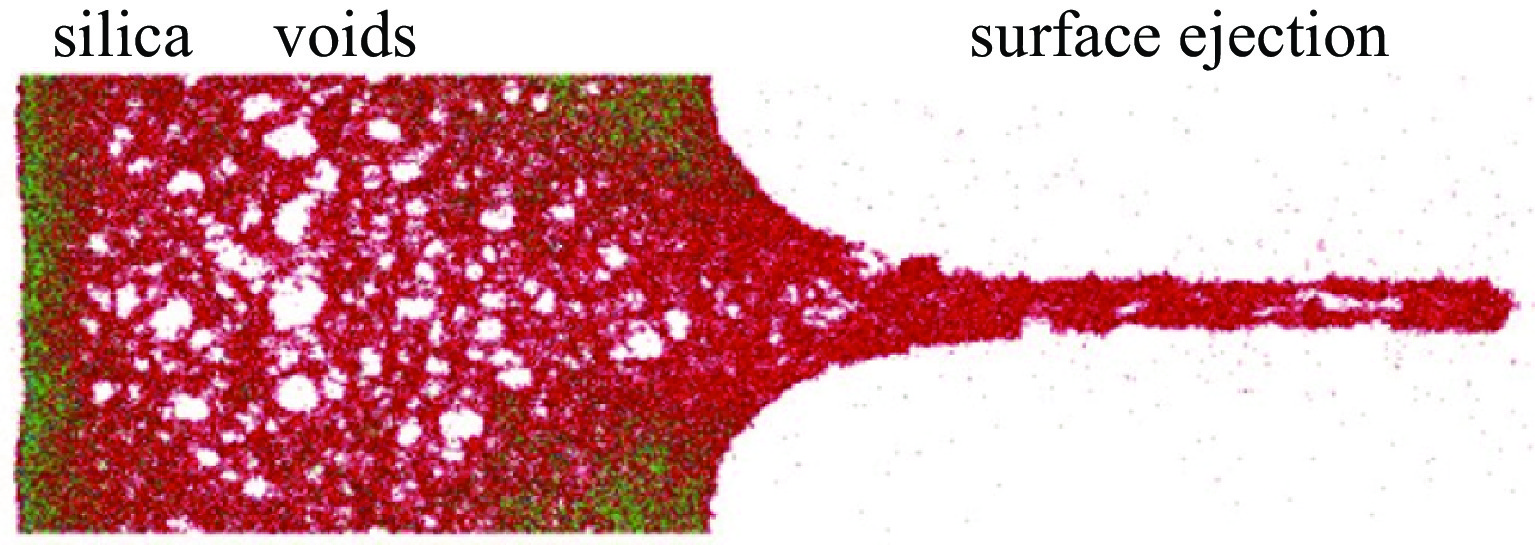
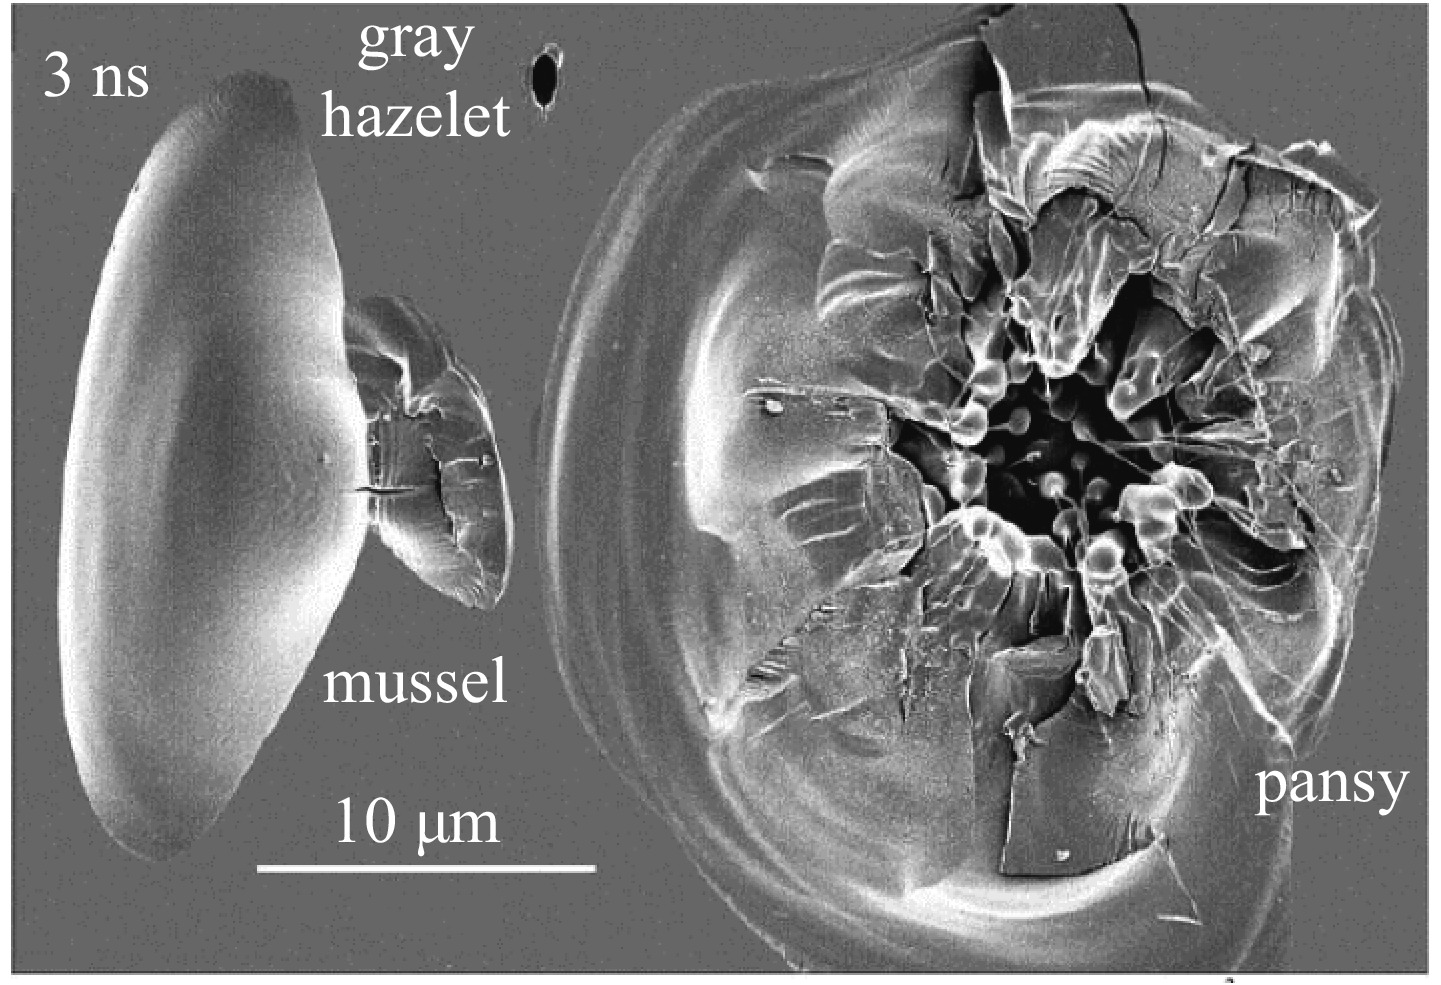
图 3 熔石英冲击导致喷溅过程分子动力学模拟[22]
Figure 3. Molecular dynamics simulation of shock-induced ejection on silica surface
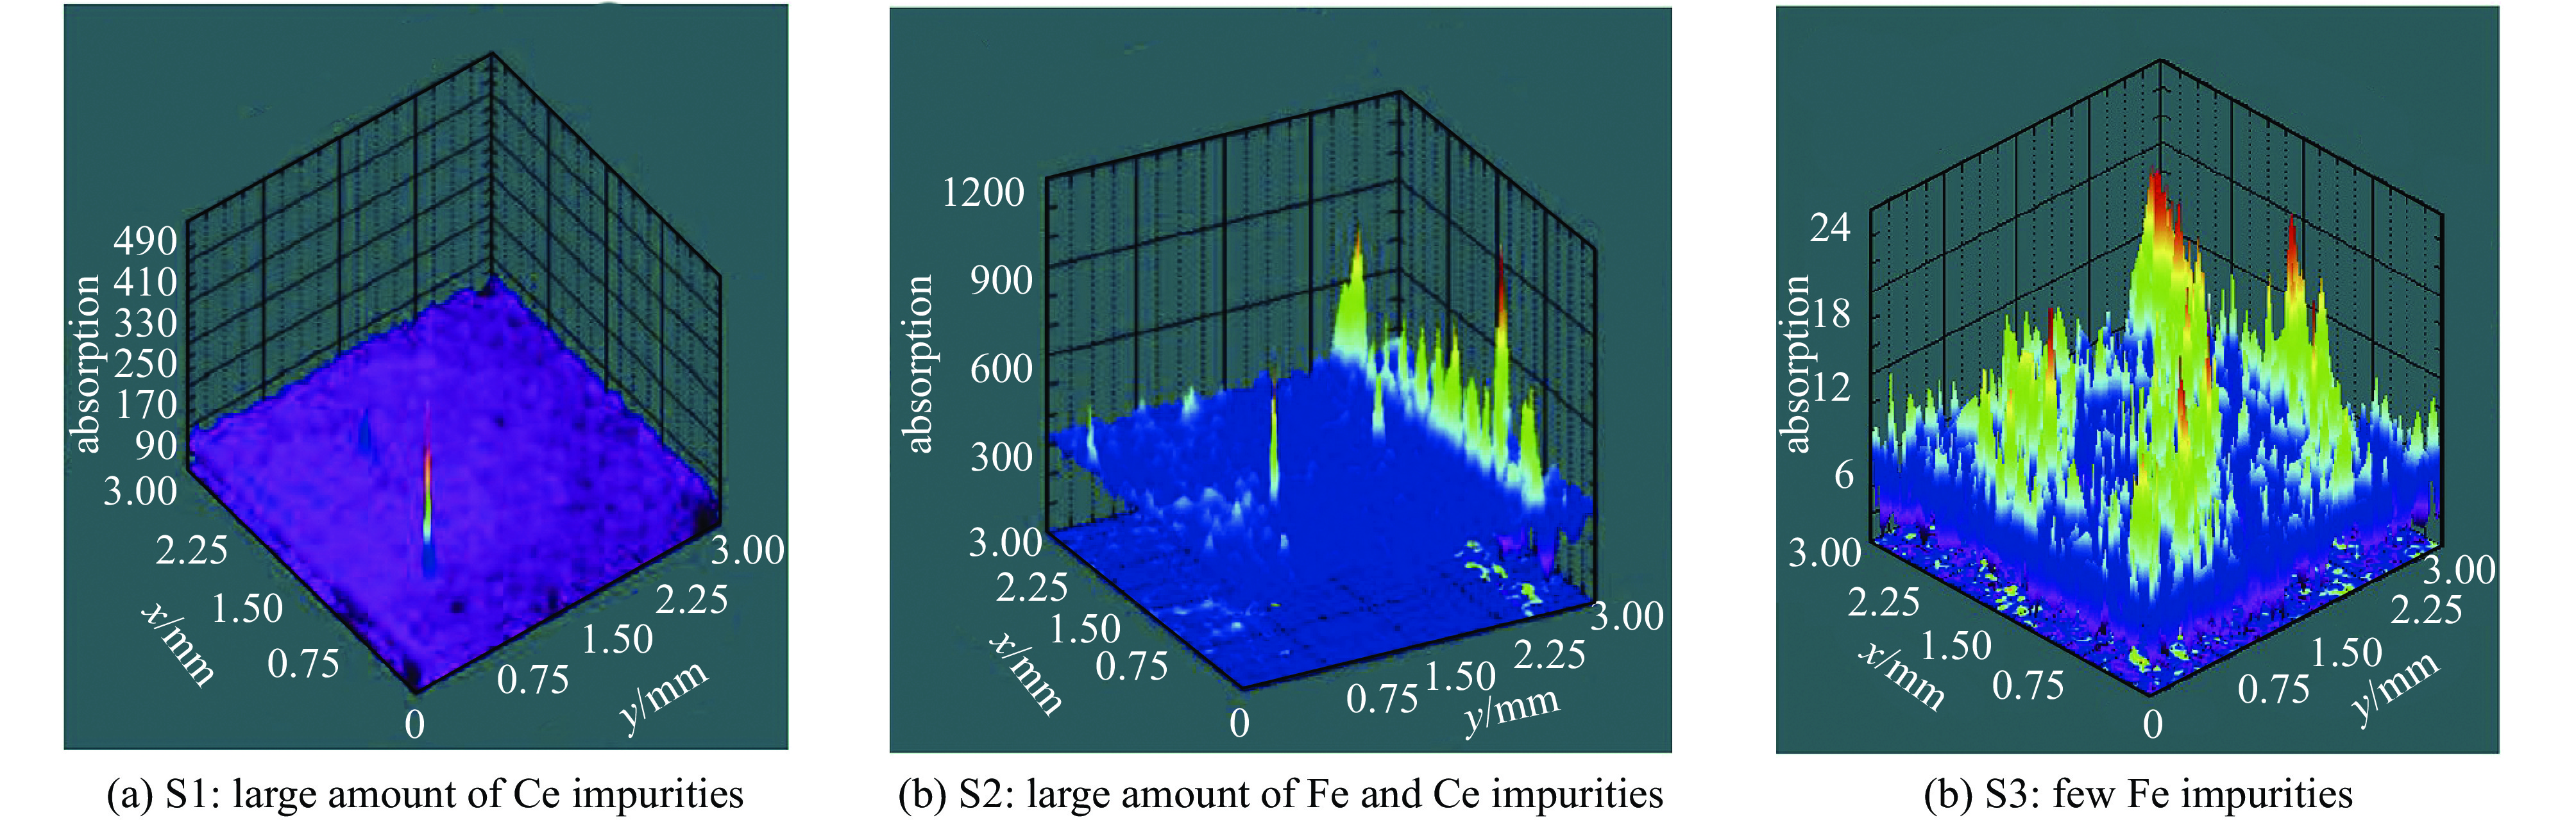
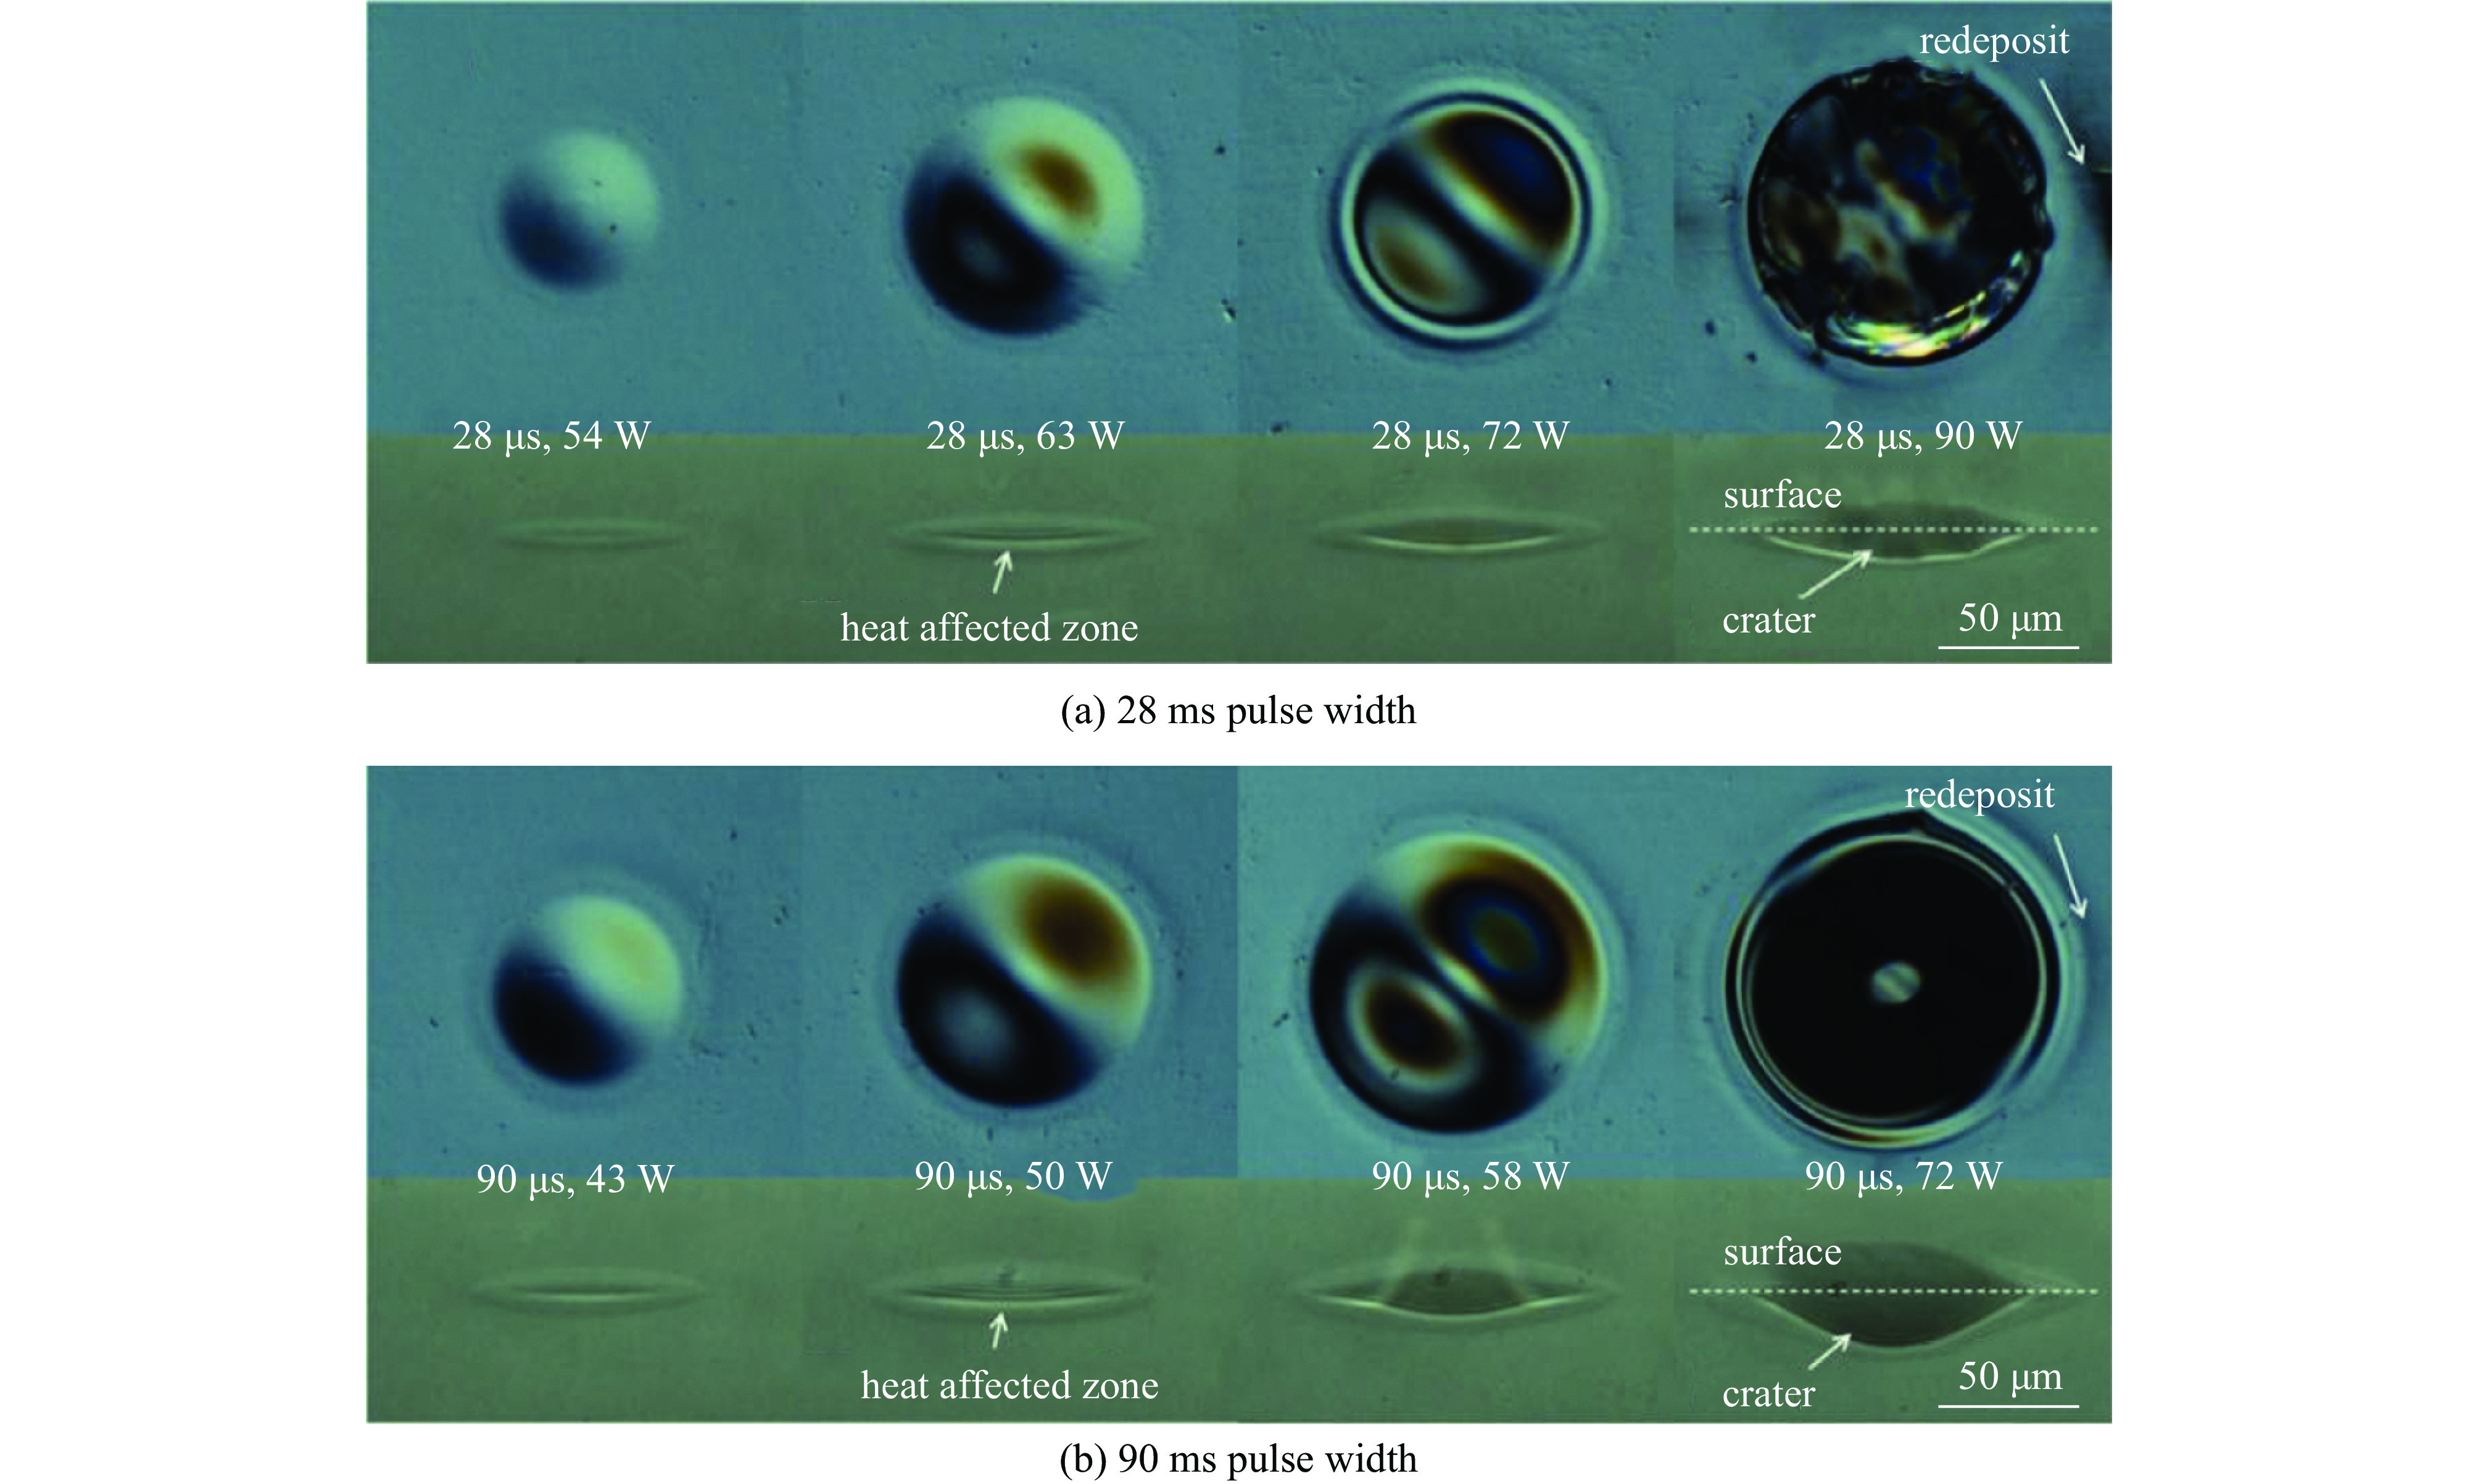
图 7 不同激光参数下的损伤修复点形貌
Figure 7. Morphology of mitigated damage sites with different laser parameters
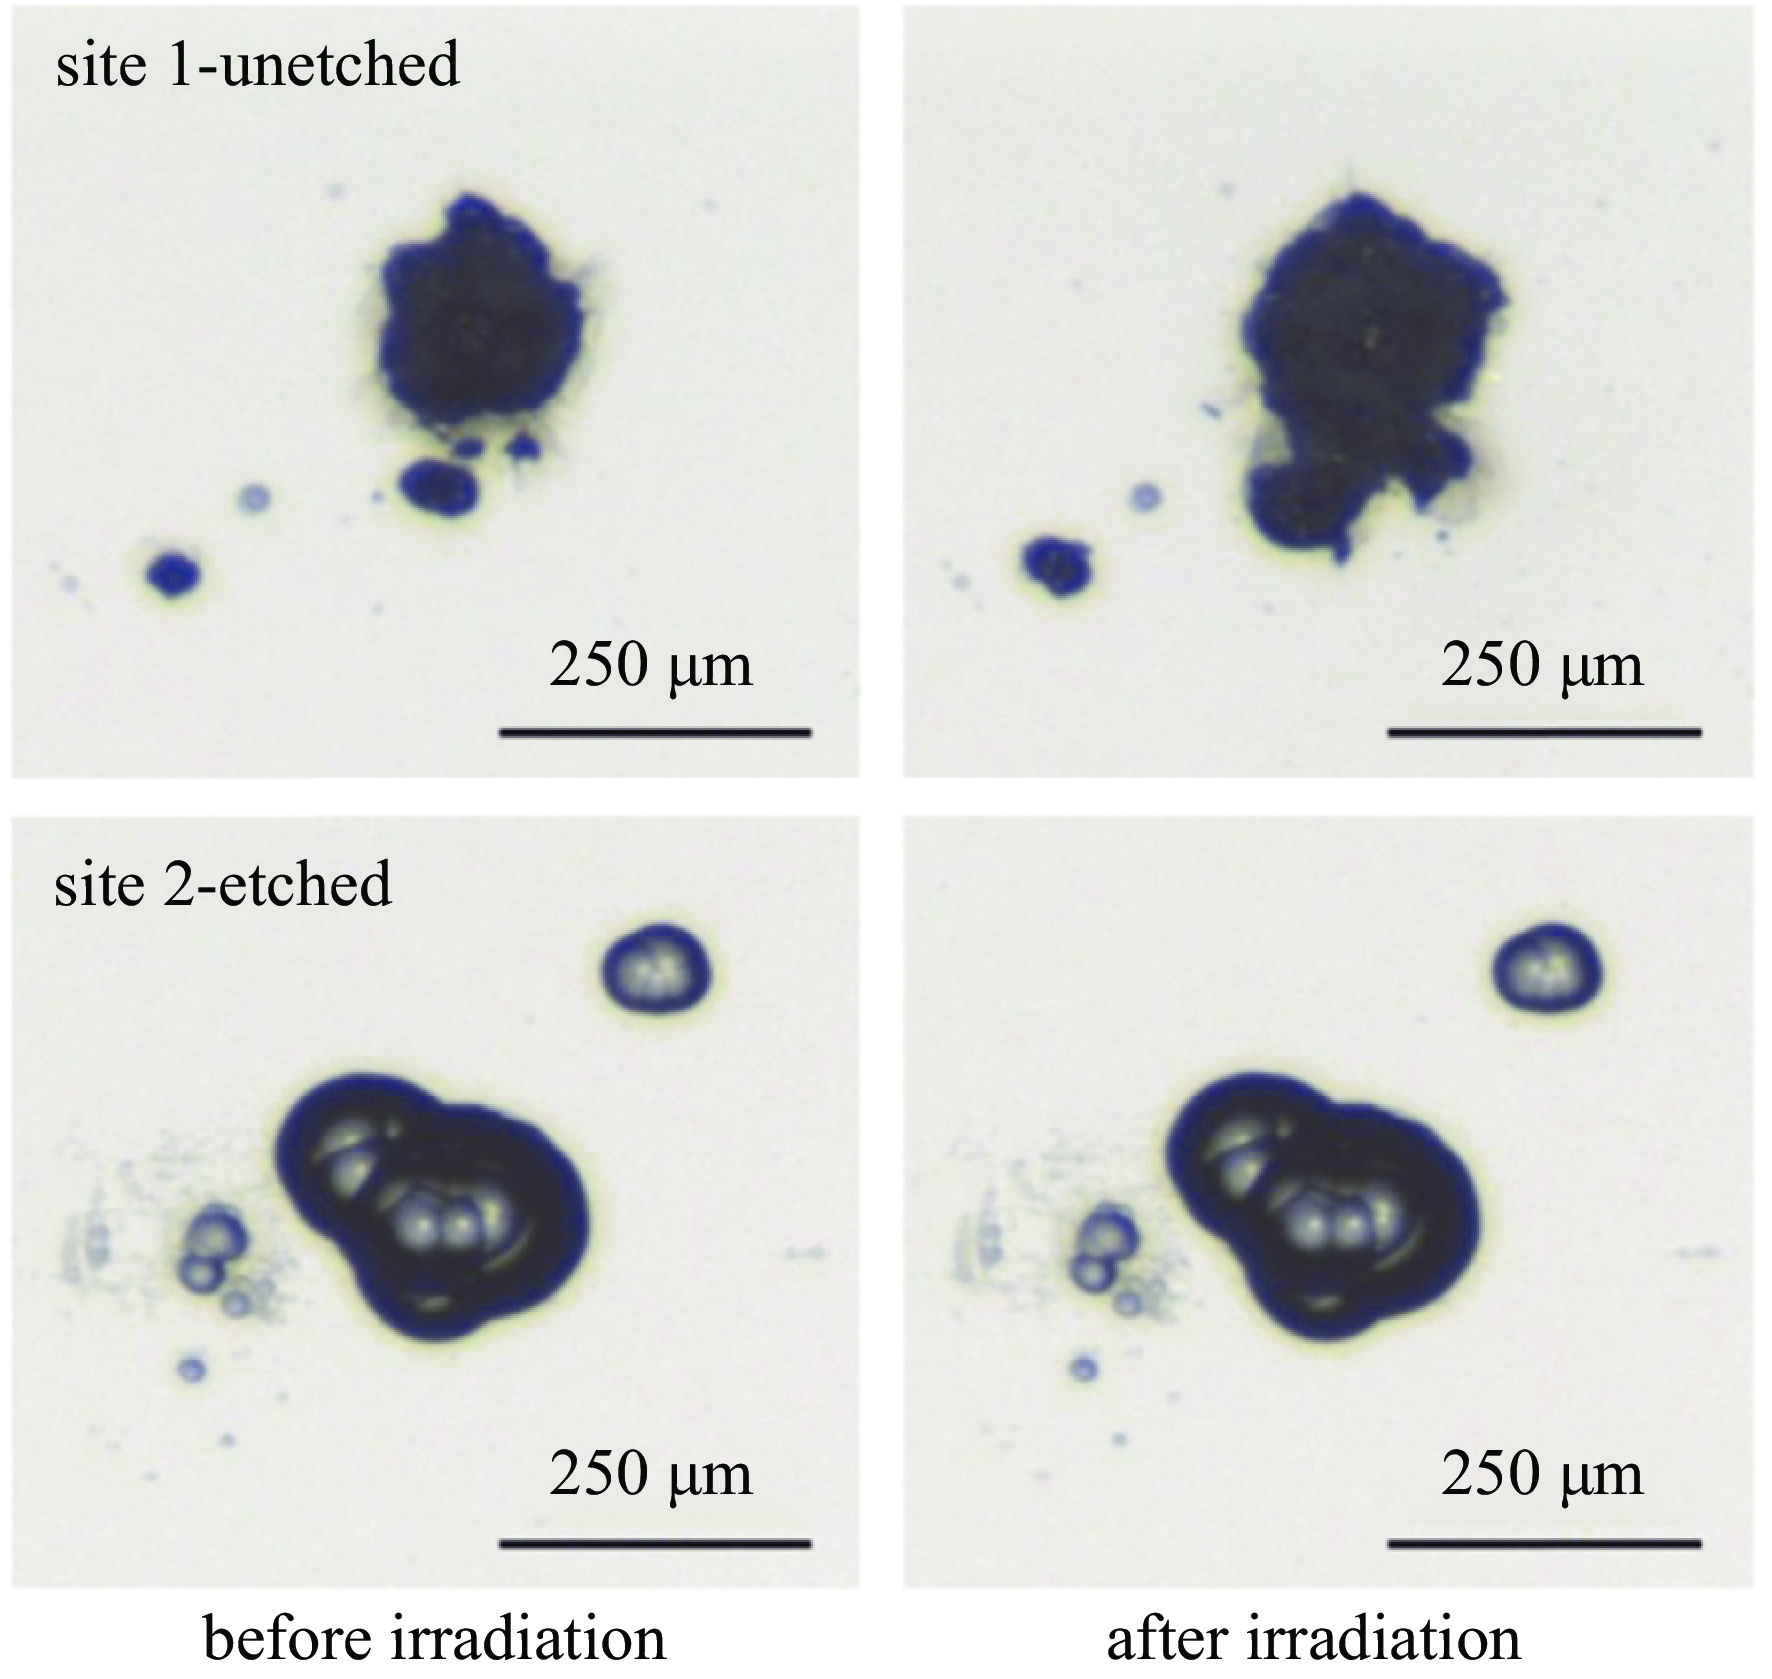
图 10 损伤点刻蚀后对8 J/cm2辐照损伤增长的抑制效果演示[63]
Figure 10. Laser damage growth of an unetched site (site 1) and an etched site (site 2) on a same optics after flat-top-shaped ultraviolet laser irradiation with the wavelength of 351 nm, the duration of 5.0 ns and the fluence of 8.0 J/cm2. The Site 2 is etched 24.0 h by using HF-based solution[63]
-
[1] Zylstra A B, Hurricane O A, Callahan D A, et al. Burning plasma achieved in inertial fusion[J]. Nature, 2022, 601(7894): 542-548. doi: 10.1038/s41586-021-04281-w [2] 郑万国, 祖小涛, 袁晓东, 等. 高功率激光装置的负载能力及其相关物理问题[M]. 北京: 科学出版社, 2014Zheng Wanguo, Zu Xiaotao, Yuan Xiaodong, et al. Damage resistance and physical problems of high power laser facilities[M]. Beijing: Science Press, 2014 [3] Manes K R, Spaeth M L, Adams J J, et al. Damage mechanisms avoided or managed for NIF large optics[J]. Fusion Science and Technology, 2016, 69(1): 146-249. doi: 10.13182/FST15-139 [4] Nicolaizeau M, Miquel J L. LMJ status: fifth bundle commissioning and PW class laser coupling[C]//Proceedings of the SPIE 10898, High Power Lasers for Fusion Research V. 2019: 1089802. [5] Bass M. When everything damaged and we didn’t know why[C]//Proceedings of the SPIE 10805, Laser-Induced Damage in Optical Materials 2018: 50th Anniversary Conference. 2018: 1080504. [6] Baisden P A, Atherton L J, Hawley R A, et al. Large optics for the National Ignition Facility[J]. Fusion Science and Technology, 2016, 69(1): 295-351. doi: 10.13182/FST15-143 [7] Hallo G, Lacombe C, Néauport J, et al. Detection and tracking of laser damage on LMJ vacuum windows by digital image correlation[C]//Proceedings of the SPIE 11732, Dimensional Optical Metrology and Inspection for Practical Applications X. 2021: 117320C. [8] 韩伟, 冯斌, 郑奎兴, 等. 高功率激光装置熔石英紫外损伤增长研究[J]. 物理学报, 2016, 65:246102 doi: 10.7498/aps.65.246102Han Wei, Feng Bin, Zheng Kuixing, et al. Laser-induced damage growth of fused silica at 351 nm on a large-aperture high-power laser facility[J]. Acta Physics Sinica, 2016, 65: 246102 doi: 10.7498/aps.65.246102 [9] 杨李茗, 黄进, 刘红婕, 等. 熔石英元件紫外脉冲激光辐照损伤特性研究进展综述[J]. 光学学报, 2022, 42:1714004 doi: 10.3788/AOS202242.1714004Yang Liming, Huang Jin, Liu Hongjie, et al. Review of research progress on damage characteristics of fused silica optics under ultraviolet pulsed laser irradiation[J]. Acta Optica Sinica, 2022, 42: 1714004 doi: 10.3788/AOS202242.1714004 [10] Wong J, Ferriera J L, Lindsey E F, et al. Morphology and microstructure in fused silica induced by high fluence ultraviolet 3ω (355 nm) laser pulses[J]. Journal of Non-Crystalline Solids, 2006, 352(3): 255-272. doi: 10.1016/j.jnoncrysol.2005.11.036 [11] Wang Ke, Ma Bin, Han Jiaqi, et al. Morphological and damage growth characteristics of shell-type damage of fused silica optics induced by ultraviolet laser pulses[J]. Applied Optics, 2019, 58(32): 8882-8888. doi: 10.1364/AO.58.008882 [12] 翟玲玲, 冯国英, 高翔, 等. 杂质诱导熔石英激光的损伤机理[J]. 强激光与粒子束, 2013, 25(11):2836-2840 doi: 10.3788/HPLPB20132511.2836Zhai Lingling, Feng Guoying, Gao Xiang, et al. Mechanism of laser damage induced by inclusions in fused silica[J]. High Power Laser and Particle Beams, 2013, 25(11): 2836-2840 doi: 10.3788/HPLPB20132511.2836 [13] 高翔, 邱荣, 周国瑞, 等. 熔石英亚表面杂质对激光损伤概率的影响[J]. 红外与激光工程, 2017, 46:0406002 doi: 10.3788/IRLA201746.0406002Gao Xiang, Qiu Rong, Zhou Guorui, et al. Effect of subsurface impurities of fused silica on laser induced damage probability[J]. Infrared and Laser Engineering, 2017, 46: 0406002 doi: 10.3788/IRLA201746.0406002 [14] 石峰, 万稳, 戴一帆, 等. 磁流变抛光对熔石英激光损伤特性的影响[J]. 光学 精密工程, 2016, 24(12):2931-2937 doi: 10.3788/OPE.20162412.2931Shi Feng, Wan Wen, Dai Yifan, et al. Effect of magnetorheological finishing on laser damage properties of fused silica[J]. Optics and Precision Engineering, 2016, 24(12): 2931-2937 doi: 10.3788/OPE.20162412.2931 [15] Carr C W, Bude J D, DeMange P. Laser-supported solid-state absorption fronts in silica[J]. Physical Review B, 2010, 82: 184304. doi: 10.1103/PhysRevB.82.184304 [16] Carr C W, Radousky H B, Rubenchik A M, et al. Localized dynamics during laser-induced damage in optical materials[J]. Physical Review Letters, 2004, 92: 087401. doi: 10.1103/PhysRevLett.92.087401 [17] Demos S G, Raman R N, Negres R A. Time-resolved imaging of processes associated with exit-surface damage growth in fused silica following exposure to nanosecond laser pulses[J]. Optics Express, 2013, 21(4): 4875-4888. doi: 10.1364/OE.21.004875 [18] DeMange P, Negres R A, Raman R N, et al. Role of phase instabilities in the early response of bulk fused silica during laser-induced breakdown[J]. Physical Review B, 2011, 84: 054118. doi: 10.1103/PhysRevB.84.054118 [19] Zhu Chengyu, Liang Lingxi, Peng Ge, et al. Explosion plume on the exit surface of fused silica during UV laser-induced damage[J]. Results in Physics, 2022, 32: 105094. doi: 10.1016/j.rinp.2021.105094 [20] Liang Lingxi, Zhu Chengyu, Yuan Hang, et al. Study of the effects of stress wave behavior in laser-induced exit-surface damage of fused silica using time-resolved multi-polariscopic imaging[J]. Journal of Laser Applications, 2021, 33: 022018. doi: 10.2351/7.0000358 [21] Jiang Yong, Liu Hufeng, Zhang Fawang, et al. Influence of ejected SiO2 particles on the laser damage thresholds of fused silica[J]. Fusion Engineering and Design, 2021, 173: 112956. doi: 10.1016/j.fusengdes.2021.112956 [22] Su Rui, Xiang Meizhen, Chen Jun, et al. Molecular dynamics simulation of shock induced ejection on fused silica surface[J]. Journal of Applied Physics, 2014, 115: 193508. doi: 10.1063/1.4876742 [23] Tian Ye, Du Jincheng, Hu Dongxia, et al. Densification effects on porous silica: a molecular dynamics study[J]. Scripta Materialia, 2018, 149: 58-61. doi: 10.1016/j.scriptamat.2018.02.007 [24] Skuja L. Optically active oxygen-deficiency-related centers in amorphous silicon dioxide[J]. Journal of Non-Crystalline Solids, 1998, 239(1/3): 16-48. [25] Lu Pengfei, Wu Liyuan, Yang Yang, et al. Stable structure and optical properties of fused silica with NBOHC-E′ defect[J]. Chinese Physics B, 2016, 25: 086801. doi: 10.1088/1674-1056/25/8/086801 [26] Feng Qingyi, Deng Hongxiang, Huang Sizhao, et al. Strong UV laser absorption source near 355 nm in fused silica and its origination[J]. Optics Express, 2021, 29(20): 31849-31858. doi: 10.1364/OE.438128 [27] Liu Hongjie, Wang Fengrui, Huang Jin, et al. Experimental study of 355 nm laser damage ignited by Fe and Ce impurities on fused silica surface[J]. Optical Materials, 2019, 95: 109231. doi: 10.1016/j.optmat.2019.109231 [28] Huang Jin, Wang Fengrui, Li Weihua, et al. Assessing the UV-pulse-laser-induced damage density of fused silica optics using photo-thermal absorption distribution probability curves[J]. Optics Letters, 2022, 47(3): 653-656. doi: 10.1364/OL.445388 [29] Bude J, Carr C W, Miller P E, et al. Particle damage sources for fused silica optics and their mitigation on high energy laser systems[J]. Optics Express, 2017, 25(10): 11414-11435. doi: 10.1364/OE.25.011414 [30] Suratwala T I, Miller P E, Bude J D, et al. HF-based etching processes for improving laser damage resistance of fused silica optical surfaces[J]. Journal of the American Ceramic Society, 2011, 94(2): 416-428. doi: 10.1111/j.1551-2916.2010.04112.x [31] Cross D A, Carr C W. Creation of high-fluence precursors by 351-nm laser exposure on SiO2 substrates[J]. Optical Engineering, 2020, 60: 031010. [32] Zhu Deyan, Li Ping, Chai Xiangxu, et al. General design and experiment for separated final optics assembly on high energy laser system[J]. Optics & Laser Technology, 2020, 128: 106213. [33] Carr C W, Cross D A, Norton M A, et al. The effect of laser pulse shape and duration on the size at which damage sites initiate and the implications to subsequent repair[J]. Optics Express, 2011, 19(S4): A859-A864. doi: 10.1364/OE.19.00A859 [34] Carr C W, Trenholme J B, Spaeth M L. Effect of temporal pulse shape on optical damage[J]. Applied Physics Letters, 2007, 90: 041110. doi: 10.1063/1.2431705 [35] Pryatel J A, Gourdin W H, Frieders S C, et al. Cleaning practices and facilities for the National Ignition Facility (NIF)[C]//Proceedings of the 9237, Laser-Induced Damage in Optical Materials. 2014: 92372H. [36] 程晓锋, 王洪彬, 苗心向, 等. 高功率固体激光驱动器污染控制及片状放大器洁净度改进[J]. 强激光与粒子束, 2013, 25(5):1147-1151 doi: 10.3788/HPLPB20132505.1147Cheng Xiaofeng, Wang Hongbin, Miao Xinxiang, et al. Contamination control for high-power solid-state laser driver and improvement of cleanliness in slab amplifiers[J]. High Power Laser and Particle Beams, 2013, 25(5): 1147-1151 doi: 10.3788/HPLPB20132505.1147 [37] Li Yuhan, Miao Xinxiang, Fang Zhenhua, et al. Damage behaviors of silica microparticles on fused silica optics under 355 nm high fluence laser[J]. International Journal of Modern Physics B, 2022, 36: 2240068. doi: 10.1142/S0217979222400689 [38] Bien-Aimé K, Belin C, Gallais L, et al. Impact of storage induced outgassing organic contamination on laser induced damage of silica optics at 351 nm[J]. Optics Express, 2009, 17(21): 18703-18713. doi: 10.1364/OE.17.018703 [39] Huang Lin, Yan Hongwei, Yan Lianghong, et al. Improvement of the environmental stability of sol-gel silica anti-reflection coatings[J]. Journal of Sol-Gel Science and Technology, 2022, 101(3): 630-636. doi: 10.1007/s10971-022-05725-z [40] Negres R A, Cross D A, Liao Z M, et al. Growth model for laser-induced damage on the exit surface of fused silica under UV, ns laser irradiation[J]. Optics Express, 2014, 22(4): 3824-3844. doi: 10.1364/OE.22.003824 [41] Liao Z M, Miller C, Cross D A, et al. Analysis of cumulative probability of growth of damage sites at the National Ignition Facility[C]//Proceedings of the SPIE 11910, Laser-Induced Damage in Optical Materials 2021. 2021: 119100M. [42] Liao Z M, Carr C W, Cross D, et al. Damage performance of fused silica debris shield at the National Ignition Facility[C]//Proceedings of the SPIE 11173, Laser-induced Damage in Optical Materials 2019. 2019: 111730Y. [43] Veinhard M, Bonville O, Courchinoux R, et al. Quantification of laser-induced damage growth using fractal analysis[J]. Optics Letters, 2017, 42(24): 5078-5081. doi: 10.1364/OL.42.005078 [44] Lacombe C, Hallo G, Sozet M, et al. Dealing with LMJ final optics damage: post-processing and models[C]//Proceedings of the SPIE 11514, Laser-induced Damage in Optical Materials 2020. 2020: 115140G. [45] Huang Wanqing, Han Wei, Wang Fang, et al. Laser-induced damage growth on larger-aperture fused silica optical components at 351 nm[J]. Chinese Physics Letters, 2009, 26: 017901. doi: 10.1088/0256-307X/26/1/017901 [46] Cormont P, Houee C, Da Costa Fernandes B, et al. Recycle loop deployed for the large optical components of Megajoule laser[C]//Optical Design and Fabrication 2019 (Freeform, OFT). 2019: JT5A. 9. [47] Spaeth M L, Wegner P J, Suratwala T I, et al. Optics recycle loop strategy for NIF operations above UV laser-induced damage threshold[J]. Fusion Science and Technology, 2016, 69(1): 265-294. doi: 10.13182/FST15-119 [48] Ye Xin, Huang Jin, Liu Hongjie, et al. Advanced mitigation process (AMP) for improving laser damage threshold of fused silica optics[J]. Scientific Reports, 2016, 6: 31111. doi: 10.1038/srep31111 [49] Mendez E, Nowak K M, Baker H J, et al. Localized CO2 laser damage repair of fused silica optics[J]. Applied Optics, 2006, 45(21): 5358-5367. doi: 10.1364/AO.45.005358 [50] 李熙斌, 吕海兵, 向霞, 等. CO2激光对熔石英表面小尺寸损伤的修复[J]. 强激光与粒子束, 2010, 22(9):2209-2213 doi: 10.3788/HPLPB20102209.2209Li Xibin, Lv Haibing, Xiang Xia, et al. Small size damage mitigation on fused silica surface with CO2 laser[J]. High Power Laser and Particle Beams, 2010, 22(9): 2209-2213 doi: 10.3788/HPLPB20102209.2209 [51] Matthews M J, Bass I L, Guss G M, et al. Downstream intensification effects associated with CO2 laser mitigation of fused silica[C]//Proceedings of the SPIE 6720, Laser-Induced Damage in Optical Materials. 2007: 67200A. [52] Bass I L, Guss G M, Nostrand M J, et al. An improved method of mitigating laser-induced surface damage growth in fused silica using a rastered pulsed CO2 laser[C]//Proceedings of the SPIE 7842, Laser-Induced Damage in Optical Materials. 2010: 784220. [53] Trummer S, Larkin G, Kegelmeyer L, et al. Automated repair of laser damage on National Ignition Facility optics using machine learning[C]//Proceedings of the SPIE 10805, Laser-Induced Damage in Optical Materials 2018: 50th Anniversary Conference. 2018: 108050L. [54] Zhang Chuanchao, Zhang Lijuan, Jiang Xiaolong, et al. Influence of pulse length on heat affected zones of evaporatively-mitigated damages of fused silica optics by CO2 laser[J]. Optics and Lasers in Engineering, 2020, 125: 105857. doi: 10.1016/j.optlaseng.2019.105857 [55] Demos S G, Ehrmann P R, Qiu S R, et al. Dynamics of defects in Ce3+ doped silica affecting its performance as protective filter in ultraviolet high-power lasers[J]. Optics Express, 2014, 22(23): 28798-28809. doi: 10.1364/OE.22.028798 [56] Tian Ye, Han Wei, Yuan Xiaodong, et al. Structure and vibrations of cerium in silica glass from molecular dynamics simulations[J]. Journal of the American Ceramic Society, 2021, 104(1): 208-217. doi: 10.1111/jace.17453 [57] Zheng Tianran, Liu Hongjie, Wang Fang, et al. Design of laser beam dump with high laser-induced-damage threshold[J]. Optics & Laser Technology, 2022, 146: 107561. [58] 方振华, 陈静, 蒋晓龙, 等. 熔石英元件的飞秒激光改性装置及其损伤点复合修复方法: CN112608035B[P]. 2022-06-07Fang Zhenhua, Chen Jing, Jiang Xiaolong, et al. Femtosecond laser modification device of fused quartz element and composite repair method of its damage point: CN112608035B[P]. 2022-06-07 [59] Sun Laixi, Huang Jin, Shao Ting, et al. Effects of combined process of reactive ion etching and dynamic chemical etching on UV laser damage resistance and surface quality of fused silica optics[J]. Optics Express, 2018, 26(14): 18006-18018. doi: 10.1364/OE.26.018006 [60] Shao Ting, Shi Zhaohua, Sun Laixi, et al. Role of each step in the combined treatment of reactive ion etching and dynamic chemical etching for improving the laser-induced damage resistance of fused silica[J]. Optics Express, 2021, 29(8): 12365-12380. doi: 10.1364/OE.415438 [61] Sun Wenfeng, Xiang Xia, Li Bo, et al. A recycling strategy of ion beam removal and recoating of sol-gel film on fused silica surface[J]. Optik, 2021, 242: 167259. doi: 10.1016/j.ijleo.2021.167259 [62] Jiang Xiaolong, Liao Wei, Li Bo, et al. Removal of antireflection sol-gel SiO2 coating based on Ar ion beam etching[J]. Fusion Engineering and Design, 2020, 156: 111578. doi: 10.1016/j.fusengdes.2020.111578 [63] Liu Taixiang, Yang Ke, Zhang Zhuo, et al. Hydrofluoric acid-based etching effect on surface pit, crack, and scratch and laser damage site of fused silica optics[J]. Optics Express, 2019, 27(8): 10705-10728. doi: 10.1364/OE.27.010705 -

 下载:
下载:
 点击查看大图
计量
- 文章访问数: 893
- HTML全文浏览量: 265
- PDF下载量: 202
- 被引次数: 0
