

Simulation study and validation of improved amplified source method
-
摘要: 针对源倍增法测量次临界度受到基波份额变化以及通量畸变影响的问题,有文献提出使用环形“集总”探测器布置和“刻度曲线”来改善其测量结果的方法。为了验证该方法的实用性,用超级蒙特卡罗核模拟软件系统SuperMC与混合评价数据库HENDL,以日本京都大学KUCA铅基实验装置为对象, 展开了模拟研究。研究结果表明:该改进方法在KUCA实验装置上是适用的,说明此改进方法具有较好的工程应用潜力。模拟结果表明,使用KUCA装置中现有的六个裂变室进行“集总”探测可以给出相对准确的“测量”次临界度,但为了使测量结果更加准确,在未来实验中,可以在堆芯外围布置更多对称的探测器进行“集总”探测。Abstract: Amplified Source Method(ASM) is based on point kinetics model. While used in Accelerator Driven System(ADS) with deep subcriticality and strong external source, its result is affected by the external source effect, the fundamental flux effect and the spatial effect seriously. In order to solve this problem, an annular detector positioning method with calibration has been given. In order to test the practicality of this method, further study is performed against the Kyoto University Critical Assembly by Super Monte Carlo Program for Nuclear and Radiation Simulation(SuperMC) with the HENDL database. Numerical results demonstrate that the proposed method works well for the problem and the six fission chambers in the assembly can give a good measurement result. And more detectors arranged on the fringes of the core are needed in the upcoming experiments to get more accurate measurement results.
-
Key words:
- amplified source method /
- subcriticality /
- KUCA
-
自工业革命以来,传统化石燃料的大规模应用,排出的温室气体逐年积累,能源领域的二氧化碳排放占整个温室气体排放的比重非常大,引发严重的全球变暖问题[1]。核能作为一种低碳能源,在我国未来能源向低碳方向的转型过程中将有着巨大的发展前景。目前不同国家选择的核燃料循环处理方式不同,但究竟孰优孰劣在学术界一直存在争论:J.Deutch[2]和M.Bunn等[3]的研究结果都倾向于支持“开式热堆一次通过”战略; 而T.Suzuki[4]、OECD/NEA[5]和徐銤[6]的研究小组则认为“闭式循环”战略更值得研究和关注。我国关于核燃料循环的政策一直是采用闭式循环,经过长期的探索和研究,核燃料循环方案发展至今已有六七种之多[7]。考虑到我国国情以及技术成熟性,本文选取了四种典型的核燃料循环方案,采用平衡物质流模型对不同方案的可持续性进行分析,基于平准化电力成本对燃料循环过程的经济性进行评价。
1. 四种核燃料循环方案概述
为充分利用铀资源、实现核能可持续发展,乏燃料的回收再利用问题倍受核学界关注。我国的核燃料循环政策是闭式循环,目前比较成熟又适合我国国情的方案有:一次通过方案、单次复用方案、快堆闭式循环方案及混合堆闭式循环方案四种[7-9]。
一次通过方案(OTC)也叫直接处置方案(以下简称OTC方案)。目前大部分国家的反应堆都采用这种燃料循环方案。该方案的优点是流程简单、无核扩散危险、风险小等。它的主要不足之处在于铀资源利用率低、核废物毒性和量大等。
单次复用方案也称为部分再循环方案和二次通过循环方案(TTC)(以下简称TTC方案)。除了UOX燃料,反应堆也可以装载MOX燃料。UO2乏燃料经短暂的冷却后被送往回收工厂,对铀和钚进行提取回收(通常UO2乏燃料中U的质量分数为99%)。回收得到的钚将被制成MOX燃料,送往反应堆重新用于发电。在TTC方案中,钚只循环利用一次,即不对MOX乏燃料进行回收利用。
快堆闭式循环方案(FRC)也叫(Pu+MA)完全再循环方案(以下简称FRC方案)。该方案的特点是分离回收乏燃料中的超铀元素(TRU),制造快堆燃料,在快堆中“反应”卸出的乏燃料再次被回收分离出超铀元素(TRU),重新制造快堆燃料,循环使用。
混合堆闭式循环方案(HRC)(以下简称HRC方案)中,利用热核聚变产生的大量中子驱动次临界裂变堆而释放能量,热核聚变提供强中子源,次临界裂变包层承担主要的放能任务[10]。该包层采用天然铀或轻水堆乏燃料的锆合金为裂变燃料、轻水作冷却剂、Li4SiO4为氚增殖剂,后处理以干法为主且不用分离铀和钚[11]。
2. 不同燃料循环方案的可持续性分析
2.1 平衡物质流建模
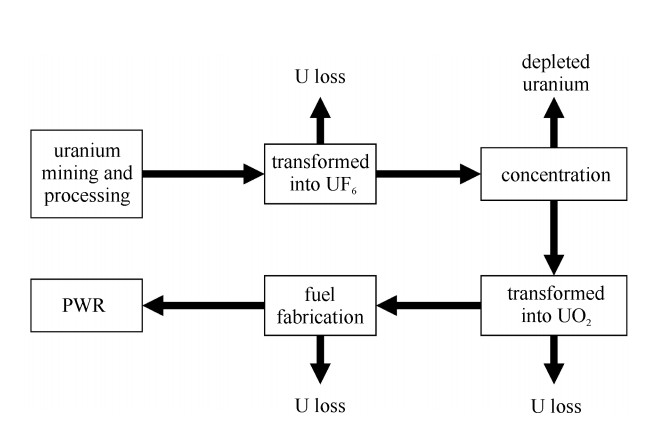
为比较不同燃料循环方案的可持续性,采用平衡物质流模型对各方案的核资源利用率及放射性核废料产出量展开分析。不同的循环方案对应有不同的物质流计算模型,其计算公式也不尽相同[7]。以OTC方案为例(见图 1):OTC方案不需要计算循环后端的物料,UO2组件装进热能谱轻水冷却反应堆中,经过几年辐照后,再卸出反应堆,进行“冷却贮存”后,转运到暂存库或最终贮藏库。
 图 1 OTC方案物质流计算示意图Figure 1. Schematic diagram of mass flow calculation in the OTC option
图 1中每年反应堆的装料量M可通过其热功率、容量因子等参数计算获得。根据物质流计算示意图,已知M后可利用公式(1)算出反应堆的天然铀年需求量等参数
Mnat =F1ruse =PXp−XtXnat −Xt1ruse =MXp−XtXnat −Xt1r3use (1) 式中:Mnat表示反应堆天然铀年需求量; F,P分别表示铀浓缩过程的进料量与出料量; ruse表示浓缩、转化和核燃料制造等过程铀的利用率,取值为99.9%;XP,Xt与Xnat分别表示浓缩铀、贫铀与天然铀中235U的浓度。
根据铀浓缩过程的进出料量可直接获得贫化铀产生量,进一步利用公式(2)可计算铀浓缩过程的分离功
S=P(2Xp−1)ln(Xp1−Xp)+T(2Xt−1)ln(Xt1−Xt)−F(2Xnat−1)ln(Xnat 1−Xnat ) (2) 式中:S表示分离功; T表示贫化铀产生量。
在TTC方案中,对UOX乏燃料中的U和Pu进行回收利用,分别制成回收UOX和MOX燃料重新被反应堆辐照。轻水反应堆使用MOX燃料时很少数的堆完全使用MOX燃料作为装料,而多数堆是搭配使用MOX燃料组件和UO2燃料组件。本研究采用G.De Roo等[12]使用的模拟数据将轻水反应堆堆芯MOX燃料的重量比设定为30%。
在FRC方案中,根据快堆的转化比(CR)不同,可分为CR < 1.0与CR≥1.0两种情形:当CR < 1.0时,快堆产生的TRU无法实现自持,快堆装料需依赖轻水堆的乏燃料,并假设TRU(即MA+Pu)完全利用; 当CR≥1.0时,快堆产生的TRU足以维持自持,此时FRC方案中仅有快堆而不再需要轻水堆的参与。
在HRC方案中,将混合堆卸出的乏燃料去除裂变碎片,再添加贫化铀,重新制作成燃料元件。燃料后处理采用简单干法,后处理温度取1400 ℃,去除乏燃料中沸点在1400 ℃以下的裂变产物(Se,Kr,Rb,Cd,Sr,Sb,Te,I,Xe,Cs等元素的各种同位素)[11]。
2.2 反应堆的换料参数
在进行燃料循环的平衡物料分析时,需了解各种堆型的基本参数、燃料成分及其比例和燃料循环前端、后端的物料基本计算公式。本研究共对四种核燃料循环模式进行分析,涉及到的反应堆包括三类:轻水堆、快堆以及混合堆。
在实际情况中,轻水反应堆规模各有不同,而且不同的燃料管理要求下,燃料循环方式也可能有所不同。为简易起见,以一座1 000 MWe的轻水反应堆为参照模型,并且只假定一套燃料循环的参数。本文的燃料规格数据直接按照Hoffman[13]的研究报告数据设定,见表 1。
表 1 轻水反应堆装料质量流Table 1. Light water reactor loading mass flownuclide mass flow/(MTHM·GWe-1·a-1) PWR UO2 PWR MOX/UO2 load after cooling load after cooling MOX UO2 MOX UO2 HM 19.5 18.494 5.719 13.667 5.425 12.964 U(235U) 19.500(0.825) 18.244(0.150) 5.22 13.667 5.041 12.788 Pu 0 0.225 0.491 0 0.343 0.157 MA 0 0.025 0.008 0 0.04 0.02 TRU 0 0.25 0.499 0 0.383 0.177 FP 0 1.006 0 0 0.293 0.703 目前我国尚未建成示范快堆,本文参考国际先进液态金属反应堆(ALMR)设计参数[14-15]。研究过程中设定了不同的增殖比,包括供求平衡情况(CR=1.0)、不产生裂变材料的情况(CR=0.0)、以及介于二者之间的情况CR=0.75和CR=0.5,然后将其特征按比例放大,用于模拟反应堆发电量1 000 MWe的情况。快堆装料质量流如表 2所示。
表 2 快堆装料质量流Table 2. Fast reactor loading mass flownuclide mass flow/(MTHM·GWe-1·a-1) fast breeder reactor fast burner reactor CR=1.23 CR=0 CR=0.5 CR=0.75 CR=1 load after cooling load after cooling load after cooling load after cooling load after cooling HM 14.84 14.01 2.78 1.906 6.194 5.324 8.203 7.327 11.19 10.34 TRU 1.287 1.507 2.741 1.866 2.064 1.667 1.74 1.575 1.552 1.571 U 13.52 12.47 0.039 0.04 4.13 3.647 6.463 5.752 9.64 8.763 FP 0 0.831 0 0.874 0 0.87 0 0.876 0 0.857 Pu 1.287 1.507 - - - - - - - - 本文裂变包层设计参数采用师学明[11]论文中的数据:混合堆中次临界包层的初始装料为996 t的天然铀,换料周期为5年。换料方案如下:将混合堆卸出的乏燃料去除裂变碎片,再添加5 t贫化铀,重新制作成燃料元件,循环使用。
2.3 计算结果分析
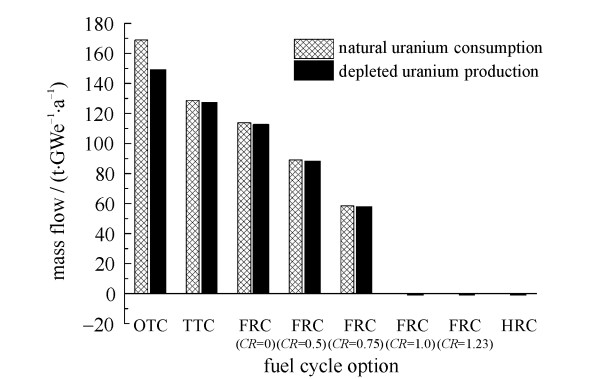
将上述相关数据代入公式(1)中展开计算,可获得不同方案的天然铀消耗量、贫铀产生量以及核废物产生量(见图 2,图 3)。图 2中,OTC方案天然铀的消耗量为168.9 t·GWe-1·a-1,而TTC方案天然铀的消耗量为128.6 t·GWe-1·a-1,比OTC方案节约23.8%的天然铀。FRC方案天然铀的消耗量受增殖比CR的影响:当CR < 1时,CR越大,循环方案消耗的天然铀越少,且FRC方案的天然铀消耗量始终低于OTC方案; 当CR≥1时,FRC方案不需要轻水堆的参与,燃料循环过程中非但不消耗天然铀还将消耗贫铀。HRC方案平均每年消耗1 t的贫铀,同样不消耗天然铀。
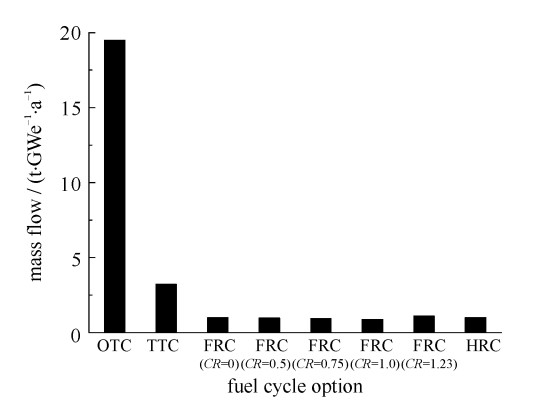
图 3给出了不同方案的核废物产生量,可看出:使用闭式燃料循环方案极大地减少了核废物总量。TTC方案核废物的产生量为3.22 t·GWe-1·a-1,仅为OTC方案的16.5%。但由于TTC方案中MOX燃料不再回收使用,导致其核废物产生量仍明显高于其它闭式燃料循环。FRC方案的核废物产生量几乎不受增殖比影响,且与HRC方案相差无几,为1.0 t·GWe-1·a-1。
3. 不同燃料循环方案的经济性分析
3.1 经济性分析方法及单元价格参数
为评价不同燃料循环方案的经济性,参考MIT研究报告[16]中给出的平准化电力成本(LCOE)计算方法进行估算
PE=∑t(Ft+It+Mt+Dt)(1+r)t∑tEt(1+r)t (3) 式中:Et为第t年的发电量; PE表示电价; Ft为第t年的燃料成本; It为第t年的投资成本; Mt为第t年的运行及维修成本; Dt为第t年的乏燃料处置费; r为折现率; t表示产品卖出或费用产生年数。
目前我国尚无商业运行的快堆与混合堆,相应的投资成本及运行维修成本仍存在较大不确定性,故本研究中不考虑这两部分的成本,仅对前端燃料与乏燃料处置两部分成本进行分析。燃料循环过程中各单元价格的准确性是保证经济性分析结果具有可信性的基础。这些单元价格的选取较为复杂且随时间波动,通过对MIT,OECD/NEA等机构发表的报告[5, 12, 16-17]进行调研与总结,获得了燃料循环过程中的单元价格(见表 3、表 4),在一定程度上提高了研究结果的可信性和准确性。
表 3 前端燃料单元的价格Table 3. Price of units of front-end fuelunit reference value/($·kgHM-1) natural uranium 100 depleted uranium 10 conversion 10a concentration 140b UOX fabrication 258c MOX fabrication 2 400 fabrication of fast reactor fuel 2 400 fabrication of hybrid reactor fuel 30d Notes:
a:The conversion price of recycled uranium is about 300% of that of the natural uranium;
b:The enrichment price of recycled uranium is about 110% of that of the natural uranium;
c:The manufacturing price of REPUOX fuel is about 107% of that of the natural uranium;
d:The fuel for the hybrid reactor is a plate structure and requires no fine processing, so the manufacturing cost is low, but there was no mature technology. Referring to the conversion process of recycled uranium, the manufacturing cost of the hybrid reactor fuel was set to 30 $·kgHM-1.表 4 燃料处置单元的价格Table 4. Price of units of fuel disposalunit reference value/($·kgHM-1) UOX temporary storage 200 MOX temporary storage 200 UOX spent fuel disposal 412 MOX spent fuel disposal 3 130 UOX HLW 190 fast reactor HLW 280 UOX reprocess 1 600 fast reactor fuel reprocess 3 200 simple dry processing 120a Notes:
a:The cost of fuel temporary cooling and storage was included in the cost of fuel reprocessing. The hybrid reactor fuel was reprocessed every five years by the simple dry process, to remove the fission products of spent fuel using the decay heat. The process was simple and required little cost, but there was no mature technology. Referring to the price of dry storage in EPRI, the price of simple dry process was set to 120 $·kgHM-13.2 不同燃料循环的经济性评价
为保证不同堆型间具有可比性,反应堆利用系数均取85%,运行时间设为40 a。将表 4、表 5中的单元价格参数以及表 3的质量流数据代入到公式(4)中,可计算出燃料循环过程中每一个环节的成本
Ci=MiPi(1+r)−Ti (4) 式中:Ci表示燃料循环中i单元考虑折现率后的成本; Mi为i单元的质量流; Pi表示i单元的价格; r为折现率,参考MIT研究数据,取7.6%;Ti为单元对应发电的提前或滞后时间。
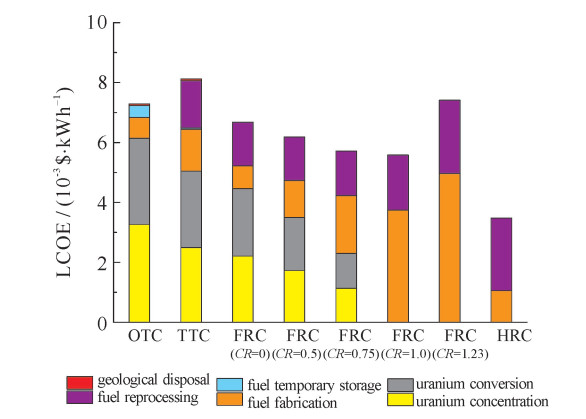
将燃料前端及后处理单元的成本累加,代入公式(3)中,可获得不同燃料循环方案的平准化电力成本(见图 4)。可以看出:相比于OTC方案,TTC方案虽没有明显降低天然铀的消耗量,但UOX乏燃料的回收及MOX燃料的加工却极大地增加了电力成本,导致TTC方案平准化电力成本较OTC方案高出16.0%,且明显高于其它闭式循环方案。FRC方案的经济性与快堆增殖比CR有关,CR越大则快堆换料量越大,燃料加工成本越高; 而另一方面,当CR < 1时,FRC方案需要轻水堆的参与,且CR越小则轻水堆的发电占比越高,天然铀、铀转化及浓缩的成本占比越高。故FRC方案存在最优解,即CR=1,此时快堆刚好维持自持,不需要轻水堆的参与,且燃料加工成本较低,经济性最佳,平准化电力成本为OTC方案的78.0%。HRC方案装料量大且换料过程需对所有燃料做后处理,燃料临时储存及冷却的成本要显著高于其它方案,但HRC方案采用板状燃料、简便干法后处理,极大地节约了燃料加工与回收的成本,故HRC方案的平准化电力成本仅为OTC方案的47.7%,远低于其它方案。
4. 结论
选取了四种典型的核燃料循环方案,采用平衡物质流模型对不同方案的可持续性进行分析,采用平准化电力成本计算方法对不同方案的经济性(仅考虑燃料成本和乏燃料处置成本)进行分析,得出以下结论:(1)相比于OTC方案,闭式燃料循环可极大地较少核废料的产生; (2)TTC方案核废料产生量仅为OTC方案的16.5%,但天然铀的消耗量依旧很大,仅比OTC方案减少了40.2 t·GWe-1·a-1; TTC方案的经济性低于其它方案,平准化电力成本较OTC方案高出16.0%;(3)FRC方案的天然铀消耗量及经济性均受快堆增殖比CR影响,当CR=1时,快堆燃料足以自持,此时FRC方案仅消耗贫铀,且经济性优于其它FRC方案,平准化电力成本仅为OTC方案的78.0%;(4)HRC方案仅消耗贫铀,且经济性最高,平准化电力成本仅为OTC方案的47.7%。
-
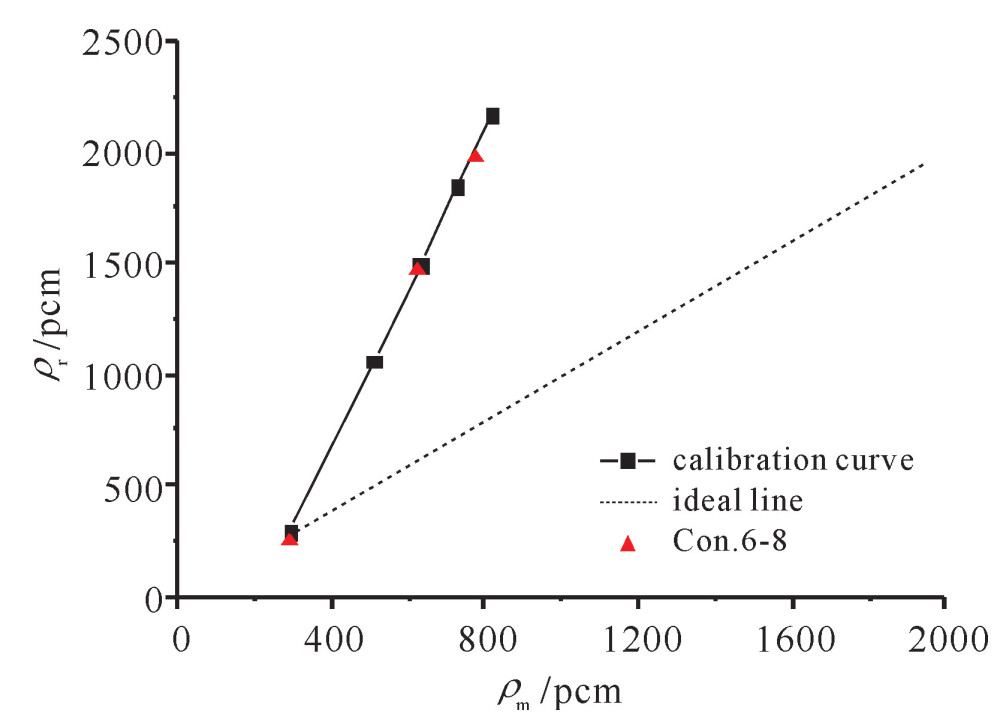
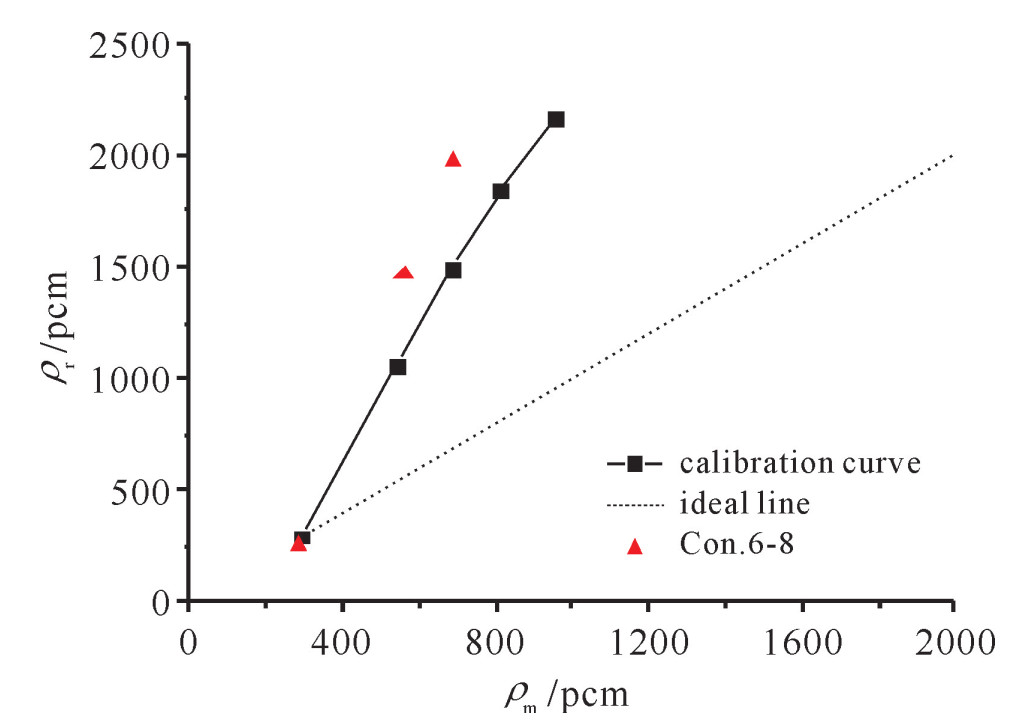
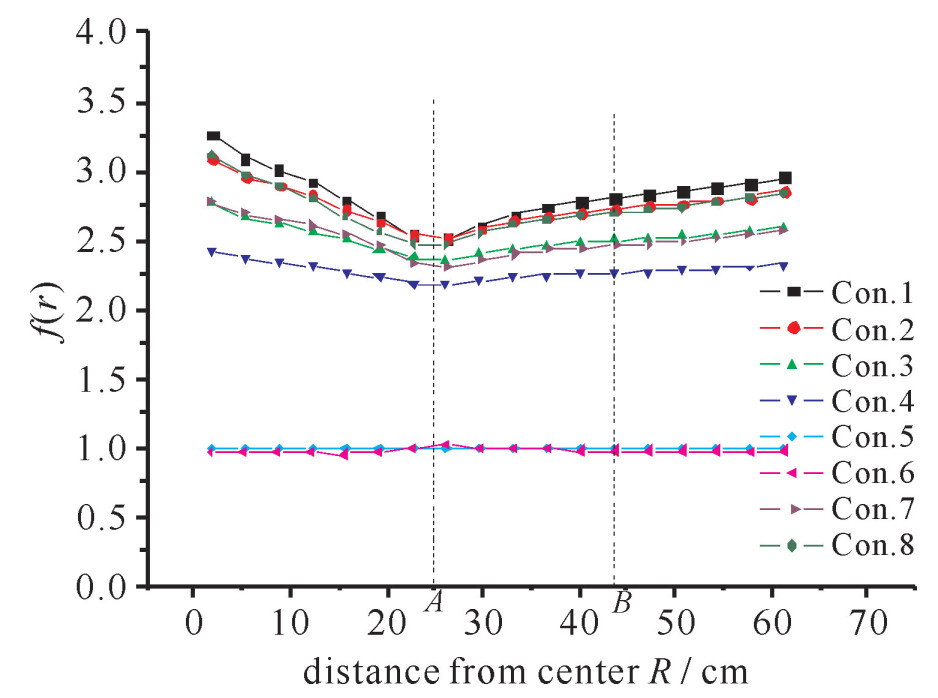
图 4 环形探测器(#4-#11)给出的测量曲线
Figure 4. Measurement curve given by annular detectors (#4-#11)
表 1 KUCA不同堆芯布置下的次临界度
Table 1. Subcriticalities of KUCA under different core conditions
case number of
fuel rodsrod insertion keff Ref.[10] simulation results |relative deviations|/% 1 46 C1, C2, C3, S4, S5, S6 0.977 50 0.978 41 0.09 2 32 all six rods withdrawn 0.954 40 0.955 05 0.07 3 26 all six rods withdrawn 0.910 42 0.910 62 0.02  下载: 导出CSV
表 2 不同工况次临界度与探测器计数
Table 2. Subcriticalities and detector counts under different core conditions
conditions control rods’ position/cm raw subcriticality
ρr/pcmdetector count
rate(#1)/10-2s-1measuring subcriticality
ρm/pcmCon.1 50 2 211.86 2.547 42 898.77 Con.2 60 1 902.52 2.995 04 764.45 Con.3 65 1 515.63 3.538 90 646.97 Con.4 70 1 120.41 4.438 02 515.90 Con.5 80 279.78 8.183 41 279.78 Con.6 C1 control rod inserted into the core 272.74 8.382 95 273.12 Con.7 C1, C2, C3, S5 control rod inserted into the core 1 479.57 4.339 80 527.57 Con.8 C1, C2, C3, S4, S5 control rod inserted into the core 2 008.55 3.535 54 647.58
下载: 导出CSV
表 3 不同探测器布置给出的工况6-8的次临界度测量结果
Table 3. Subcriticality of Con.6-8 given by different detector arrangements
conditions raw
subcriticality
ρr/ pcmsingle detector(#1) fission chamber detectors #4~#11 detectors measuring
subcriticality
ρm, 1/ pcm|ρm,1−ρrρr|/% measuring
subcriticality
ρm, 2/ pcm|ρm,2−ρrρr|/% measuring
subcriticality
ρm, 3/ pcm|ρm,3−ρrρr|/% Con.6 272.74 257.56 5.57 269.85 1.06 271.10 0.60 Con.7 1 479.57 1 148.63 22.37 1 395.83 5.66 1 459.15 1.38 Con.8 2 008.55 1 540.64 23.30 1 959.25 2.45 1 993.29 0.76
下载: 导出CSV
-
[1] 詹文龙, 徐瑚珊. 未来先进核裂变能-ADS嬗变系统[J]. 中国科学院院刊, 2012, 27(3): 375-380. doi: 10.3969/j.issn.1000-3045.2012.03.017Zhan Wenlong, Xu Hushan. Advanced fission energy program—ADS transmutation system. Bulletin of the Chinese Academy of Sciences, 2012, 27(3): 375-380 doi: 10.3969/j.issn.1000-3045.2012.03.017 [2] 陈忠, 蒋洁琼, 王明煌, 等. 加速器驱动核废料嬗变次临界堆中子学初步设计分析[J]. 核科学与工程, 2013, 33(2): 180-185. doi: 10.3969/j.issn.0258-0918.2013.02.012Chen Zhong, Jiang Jieqiong, Wang Minghuang, et al. Preliminary neutronics design analysis on accelerator driven subcritical reactor for nuclear waste transmutation. Nuclear Science and Engineering, 2013, 33(2): 180-185 doi: 10.3969/j.issn.0258-0918.2013.02.012 [3] 赵志祥, 夏海鸿. 加速器驱动次临界系统(ADS)与核能可持续发展[J]. 中国工程科学, 2008, 10(3): 66-72. https://www.cnki.com.cn/Article/CJFDTOTAL-GCKX200803012.htmZhao Zhixiang, Xia Haihong. Researches on ADS and the sustainable development of the nuclear energy. Engineering Sciences, 2008, 10(3): 66-72 https://www.cnki.com.cn/Article/CJFDTOTAL-GCKX200803012.htm [4] 罗璋琳, 史永谦, 潘泽飞. 实验反应堆物理导论[M]. 哈尔滨: 哈尔滨工程大学出版社, 2011.Luo Zhanglin, Shi Yongqian, Pan Zefei. Introduction to experimental reactor physics. Harbin: Harbin Engineering University Press, 2011 [5] Bécares V, Villamarín D, Fernández-Ordóñez M, et al. Validation of ADS reactivity monitoring techniques in the Yalina-booster subcritical assembly[J]. Ann Nucl Energy, 2013, 53: 331-341. doi: 10.1016/j.anucene.2012.10.001 [6] Uyttenhove W, Baeten P, Ban G, et al. Experimental results from the VENUS-F critical reference state for the GUINEVERE accelerator driven system project[J]. IEEE Trans Nuclear Science, 2013, 59(6): 3194-3200. https://ieeexplore.ieee.org/document/6334474/ [7] Naing W, Tsuji M, Shimazu Y. The effect of neutron source distribution on subcriticality measurement of pressurized water reactors using the modified neutron source multiplication method[J]. Journal of Nuclear Science and Technology, 2003, 40(11): 951-958. [8] Blaise P, Mellier F, Fougeras P. Application of the modified source multiplication(MSM) technique to subcritical reactivity worth measurements in thermal and fast reactor systems[J]. IEEE Trans Nuclear Science, 2011, 58(3): 1166-1176. https://www.infona.pl/resource/bwmeta1.element.ieee-art-000005740387 [9] Yang Yingkun. Preliminary study of subcriticality monitoring methods in accelerator driven subcritical systems. Beijing: University of Chinese Academy of Sciences, 2015: 30-40 [10] Pyeon C. Neutronics on solid Pb-Bi in accelerator-driven system with 100 MeV protons at Kyoto University critical assembly[R]. Reseach Reactor Institute, Kyoto University, 2015. [11] Wang Dong, Yu Shengpeng, Wang Guozhong, et al. MCAM 5: An advanced interface program for multiple Monte Carlo codes[C]//Proceedings of the SNA+ MC 2013—Joint International Conference on Supercomputing in Nuclear Applications+ Monte Carlo. 2014. [12] Chen Zhenping, Zheng Huaqing, Sun Guangyao, et al. Preliminary study on CAD-based method of characteristics for neutron transport calculation[J]. Chinese Physics C, 2014, 38: 058201. doi: 10.1088/1674-1137/38/5/058201 [13] Li Ying, Lu Lei, Ding Aiping, et al. Benchmarking of MCAM 4.0 with the ITER 3D model[J]. Fusion Engineering and Design, 2007, 82(15): 2861-2866. https://www.sciencedirect.com/science/article/pii/S0920379607000762 [14] Wu Yican. CAD-based interface programs for fusion neutron transport simulation[J]. Fusion Engineering and Design, 2009, 84(7): 1987-1992. https://www.sciencedirect.com/science/article/pii/S0920379608004948 [15] Song Jing, Sun Guangyao, Zheng Huaqing, et al. Benchmarking of super Monte Carlo simulation program SuperMC 2[C]//Proceedings of the SNA+ MC 2013—Joint International Conference on Supercomputing in Nuclear Applications+ Monte Carlo. 2014. [16] Wu Yican, Chen Zhibin, Hu Liqin, et al. Identification of safety gaps for fusion demonstration reactors[J]. Nature Energy, 2016, 1: 16154. https://www.nature.com/articles/nenergy2016154 [17] Wu Yican, Song Jing, Zheng Huaqing, et al. CAD-based Monte Carlo program for integrated simulation of nuclear system SuperMC[J]. Ann Nucl Energy, 2015, 82: 161-168. https://sna-and-mc-2013-proceedings.edpsciences.org/articles/snamc/abs/2014/01/snamc2013_06022/snamc2013_06022.html [18] 曾勤, 邹俊, 许德政, 等. 315中子/42光子耦合细群核数据库HENDL3.0/FG研发[J]. 核科学与工程, 2011, 31(4): 360-364. https://www.cnki.com.cn/Article/CJFDTOTAL-HKXY201104014.htmZeng Qin, Zou Jun, Xu Dezheng, et al. Development of fine-group(315n/42γ) cross section library ENDL3. 0/FG for fusion-fission hybrid systems. Journal of Nuclear Science and Technology, 2011, 31(4): 360-364 https://www.cnki.com.cn/Article/CJFDTOTAL-HKXY201104014.htm 期刊类型引用(2)
1. 徐伟,张国军,刘源,韩建军,白冰,张文栋. 杯型MEMS矢量水听器的设计. 微纳电子技术. 2016(06): 374-380 .  百度学术
百度学术2. 王续博,张国军,郭楠,郭静,张文栋. MEMS仿生矢量水听器微结构力学建模及实验验证. 强激光与粒子束. 2016(02): 134-139 . 本站查看其他类型引用(4)
-

 下载:
下载:

 点击查看大图

计量
- 文章访问数: 1408
- HTML全文浏览量: 346
- PDF下载量: 190
- 被引次数: 6
