

Three-dimensional refractive index reconstruction of optical fibers based on single-element interferometer computed tomography
-
摘要: 提出了一种基于单元件干涉仪的计算机断层扫描方案,用于测量光纤三维折射率分布。该单元件干涉仪基于显微成像的原理,提高了系统的横向分辨率。利用快速傅里叶变换提取相位,采用滤波反投影算法重建了光纤的折射率分布。搭建了实验测量装置,实际测量了单模和多模光纤的折射率分布。结果表明,提供的方法可以简单快速地得到全光场数据,同时具有无损和非接触的优点,并且光路结构紧凑稳定,可为计算机断层扫描设备的小型化提供一种新的思路。Abstract: A computer tomography scheme based on single-element interferometer is proposed to measure the three-dimensional refractive index distribution of optical fiber. Based on the principle of microscopic imaging, the single-element interferometer improves the lateral resolution of the system. The phase is extracted by fast Fourier transform, and the refractive index distribution of the fiber is reconstructed by filtered back projection algorithm. Based on the proposed scheme, an experimental measurement device is built to actually measure the refractive index distribution of single-mode and multimode optical fibers. The results show that the measurement can simply and quickly obtain the full optical field data, has the advantages of being lossless and non-contact, and the optical path structure is compact and stable, which provides a new idea for the miniaturization of computed tomography equipment.
-
光纤是光纤通信的传输介质,也在光学无损检测中扮演重要的角色[1-3]。光纤的带宽、散射损耗和色散等特性与其内部结构息息相关[4],反映其内部细节的关键参数就是光纤的折射率分布;调整色散补偿光纤的折射率可以实现特定水平的色散;保偏光纤可以利用光纤结构中的圆形不对称性来解耦正交偏振态。因此光纤的折射率分布成为了衡量光纤综合性能的根本指标。如果能够在非破坏性的条件下测量光纤的折射率分布,就可以更好地理解和预测光纤内部微小折射率变化的影响。
目前用于表征光纤内部结构的技术主要有原子力显微镜蚀刻[5-6]、折射近场法[7]、全息测量法[8-9]等。原子力显微镜蚀刻可以很好地展示一定范围内的细节信息,但是对光纤具有破坏性,且成本较高;折射近场法虽然能够测量二维折射率分布,但也要破坏光纤,且扫描系统结构复杂,耗时较长;全息测量的方法具有非接触性、非破坏性、检测方便快捷等特点。通过结合计算机断层扫描技术[10-11],一般应用于物体的三维折射率重建,如光纤、精密玻璃、生物组织和细胞等[12-16]。2009年,Wahba等人首次运用数字全息试验,确定了渐变折射率光纤中的抛物线折射率场的分布,采用相移方法提取相位,再结合光纤的多层模型来确定折射率,可对纤芯直径较大的光纤进行折射率重建[17]。2013年,潘哲朗等人研究了数字全息层析成像技术测量微毛细管结构的可行性,采用了单幅全息图获取到的复振幅数据模拟不同角度下的投影数据,分别利用滤波反投影和衍射层析进行了折射率三维重构[18]。同年,苏玲珑等人构建了预放大透射式数字全息显微系统,其中加入了样品转动装置,利用样品转动记录180°视角内各个角度的显微全息图,并基于滤波反投影重建了普通单模光纤和熊猫型保偏光纤[19]。2014年,Wahba又考虑了穿过保偏光纤的入射光线的局部折射,重建了熊猫型保偏光纤的两个双折射轴上的折射率分布[20];Sokkar等人提出了单帧计算机断层扫描(SFCT)技术,测量了颈缩现象形成之前、期间和之后光学特性的变化,确定了聚合物纤维内部三维折射率分布[21]。2015年,谷婷婷等人利用数字全息显微层析技术构建了光纤折射率测量系统,结合软件系统可以得到记录最优的数字全息图,并通过模拟相位提取和光纤多层模型,还原了光纤断层面沿直径方向的折射率分布[22]。2017年,黄素娟等人通过数字全息显微层析,测量了扭转保偏光纤的三维折射率,采用边缘检测提取了光纤不同断面应力柱的位置,还计算了扭转角度[23]。2019年,王伟平等人用空间光调制器加载的涡旋相位做相移,再通过数字全息显微系统测量了特殊光纤的三维折射率[24]。同年,Sung等人使用数字全息显微技术测量了玻璃的维氏压痕下的折射率变化[25],Yassien等人用数字全息显微研究了伽马辐射计量对于聚四氟乙烯纤维折射率的改变[26]。2021年,研究人员将数字全息层析成像方法分别结合卷积神经网络和光弹效应对聚合纤维的特性进行了研究[27-28]。
本文提出了一种基于单元件干涉仪[29-30]的计算机断层扫描光路系统,相较于传统基于马赫泽德干涉仪的显微层析系统,结构紧凑,光路简单,易于实现,共光路的设计减少了光学元件的附加相位和曲率不匹配等问题,提高了干涉图的质量。基于显微成像的方式,无需进行传输计算,提高了横向分辨率。用基于快速傅里叶变换的相位提取方法,能够准确地得到光纤投影的相位,为滤波反投影算法提供可靠的相位信息。实验中以单模和多模光纤为试验样品进行了测量,得到了光纤内部三维折射率的分布。
1. 单元件干涉断层扫描方案和原理
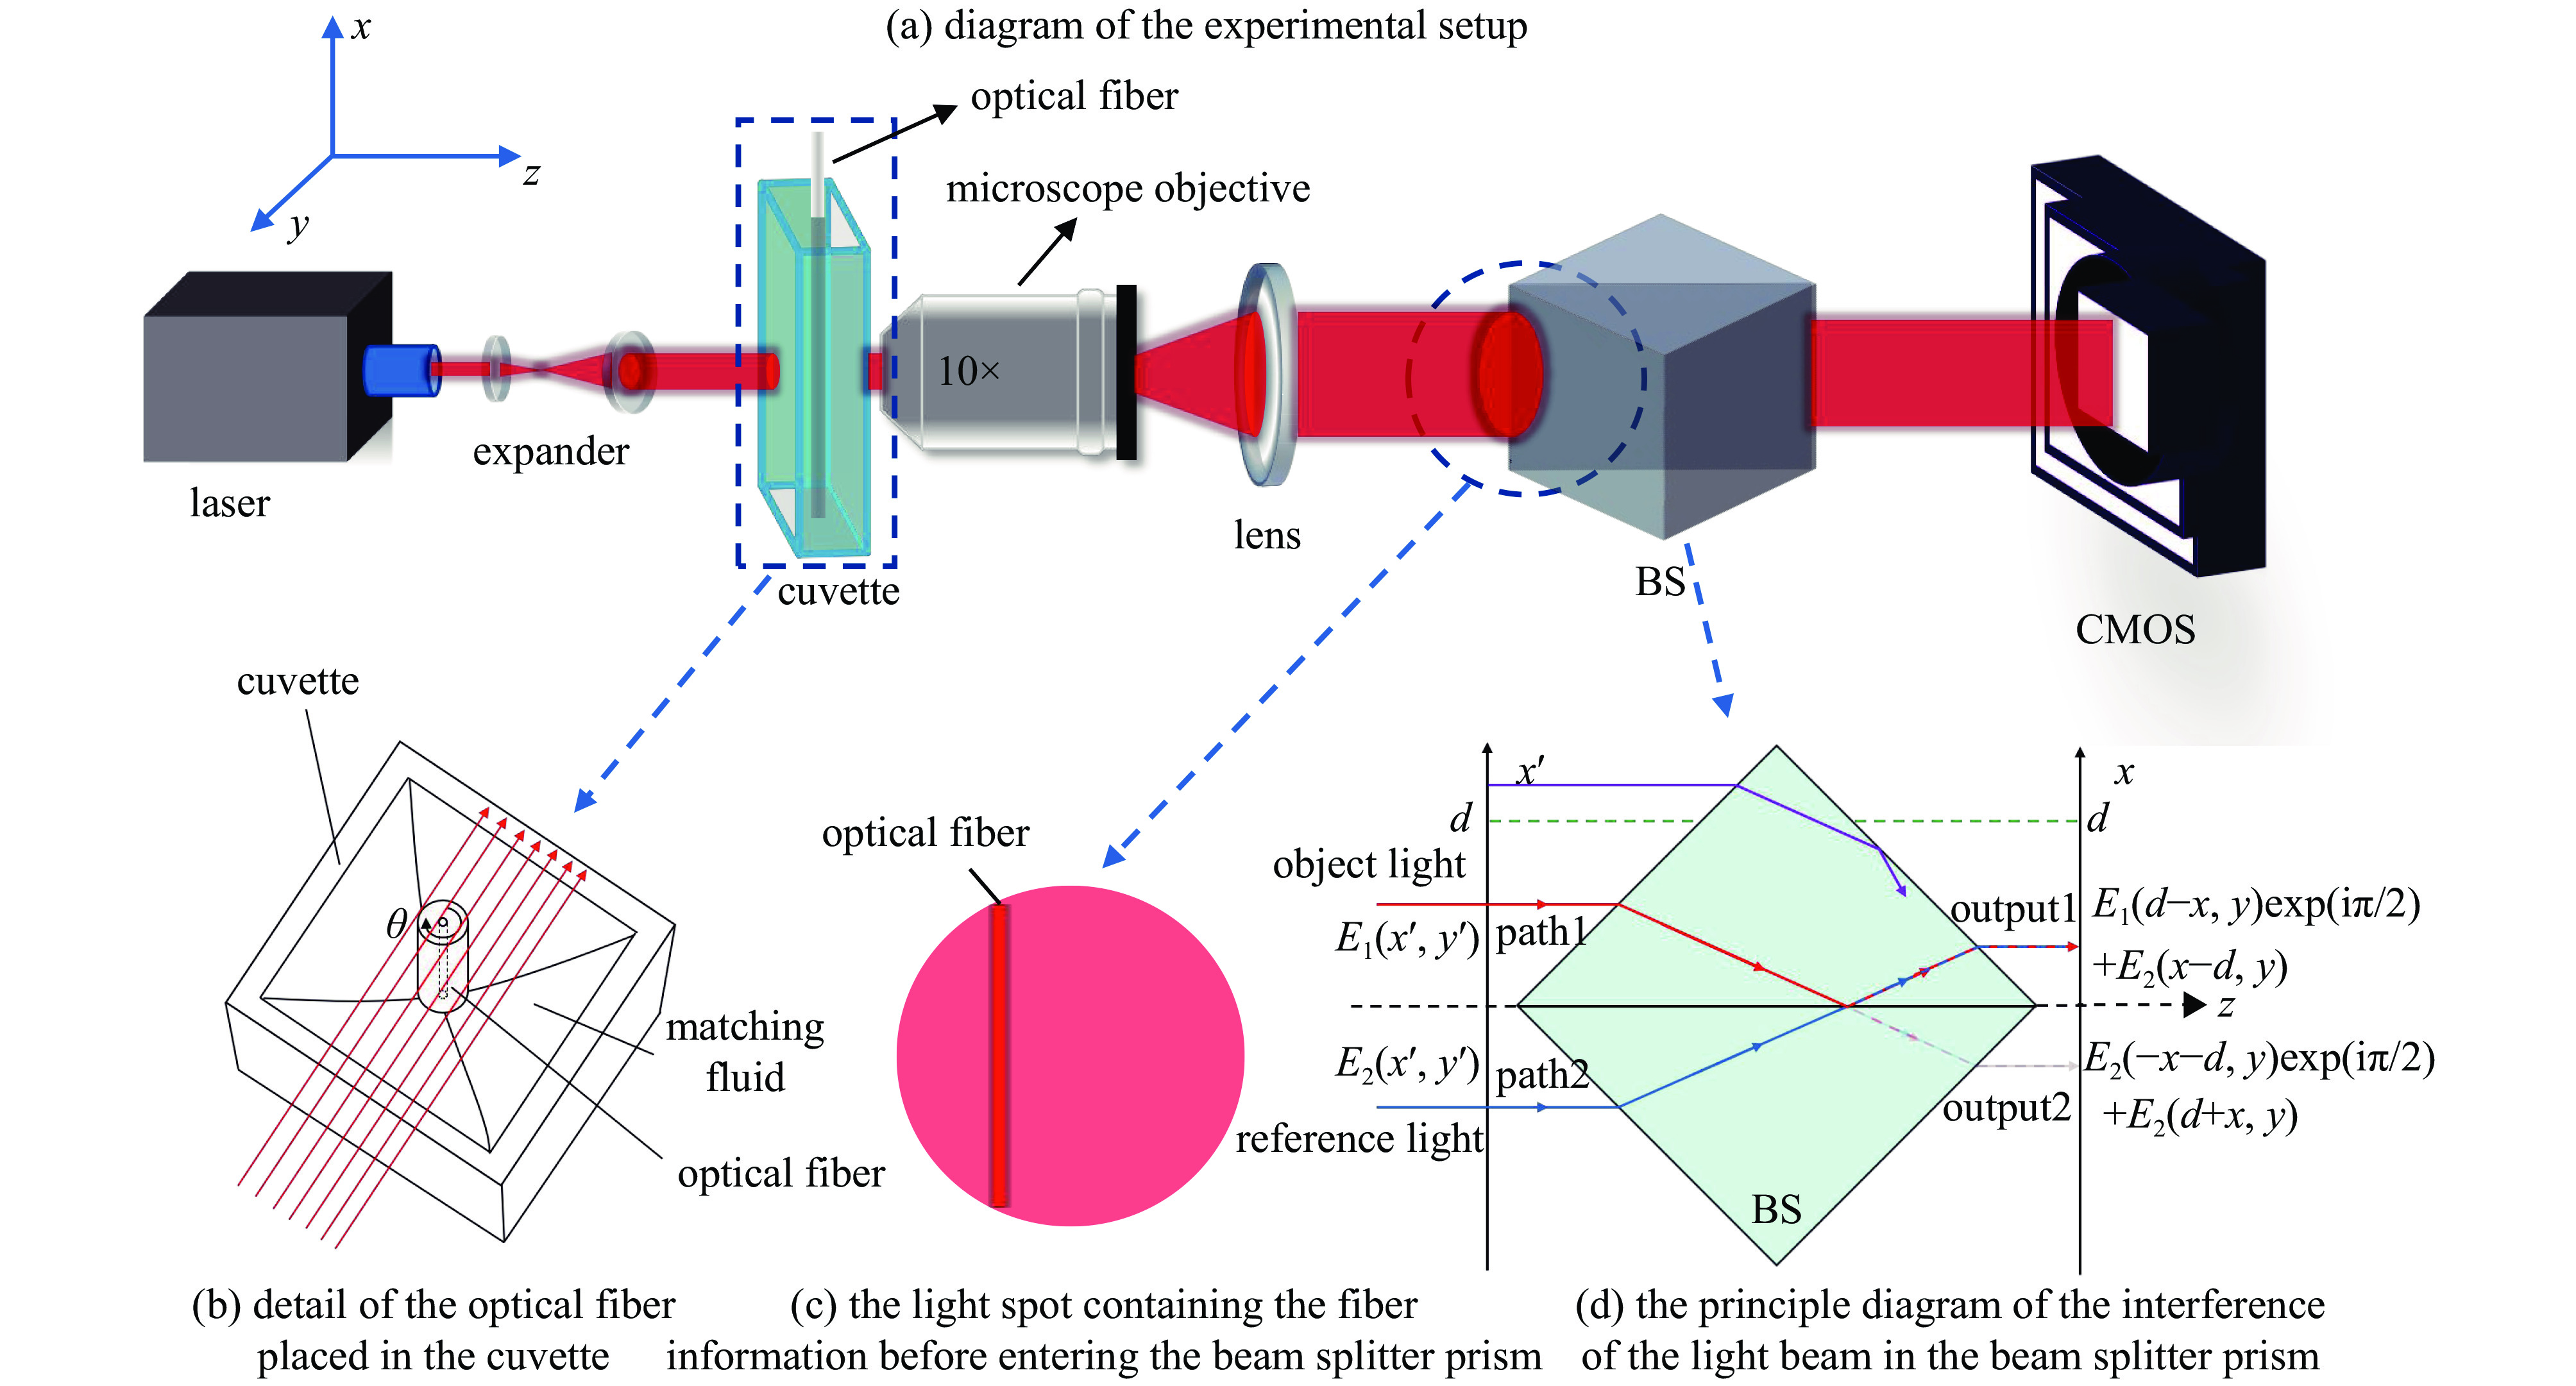
基于单元件干涉的显微断层成像的光纤折射率测量方案如图1所示。光路系统装置如图1(a)所示。波长为664 nm的LD激光经过准直入射至比色皿,将被测光纤竖直放置在比色皿中,并加入与光纤包层折射率接近的匹配液,如图1(b)所示。显微物镜放大倍数为10倍(大恒光电10×),经显微物镜放大的光束中包含光纤的相位信息,如图1(c)所示,单元件的分光光路如图1(d)所示。经过单元件分光棱镜后的干涉条纹被CMOS (2048×1536 pixel,2.8×2.8 μm/pixel)探测。
 图 1 基于单元件干涉的显微断层成像的光纤折射率测量Figure 1. Optical fiber refractive index measurement of micro tomography based on unit interference
1.1 基于单元件显微干涉的基本原理
设入射面上半部分和下半部分光的复振幅分别为E1(x′, y′)和E2(x′, y′),当它们分别入射到分光棱镜后,在棱镜的半反半透膜上将产生相位差,这是因为在分光膜上发生反射时将会出现相位π的跳变。E1(x′, y′)的反射光与E2(x′, y′)的透射光发生干涉从端口1输出;E1(x′, y′)的透射光与E2(x′, y′)的反射光发生干涉从端口2输出,从而产生一个关于x轴对称的干涉条纹图样。在经过多次试验之后,选择的匹配液为折射率为1.461 1的甘油与去离子水的混合溶液。
设物体本身的折射率分布为n(θ=0, x, y, z),当被测物体沿着x轴旋转角度θ时其折射率分布变为nθ (x, y, z),也可表示为n(θ, x′, y′, z′),其折射率分布遵从空间变换关系
[x′y′z′]=Rx(θ)[xyz] (1) 式中:
$ {{\boldsymbol{R}}_x}(\theta ) $ 为旋转矩阵。Rx(θ) = [1000cosθ−sinθ0sinθcosθ] (2) 若物体的折射率与周围环境介质折射率n0差异很小,沿z方向传输的光通过物体后的投影相位变化可表示为
Δφp(θ,x,y)=∫2π λ[nθ(x,y,z)−n0]dz (3) 式中:λ为入射光波长。
为了能够获取物体内部的细节,得到三维折射率分布,就需要利用断层扫描技术。具体的方法是:将物体沿着x方向旋转角度θ,得到相应的投影相位图,再根据这些相位图执行投影重建算法,最终重建出物体的三维折射率分布。
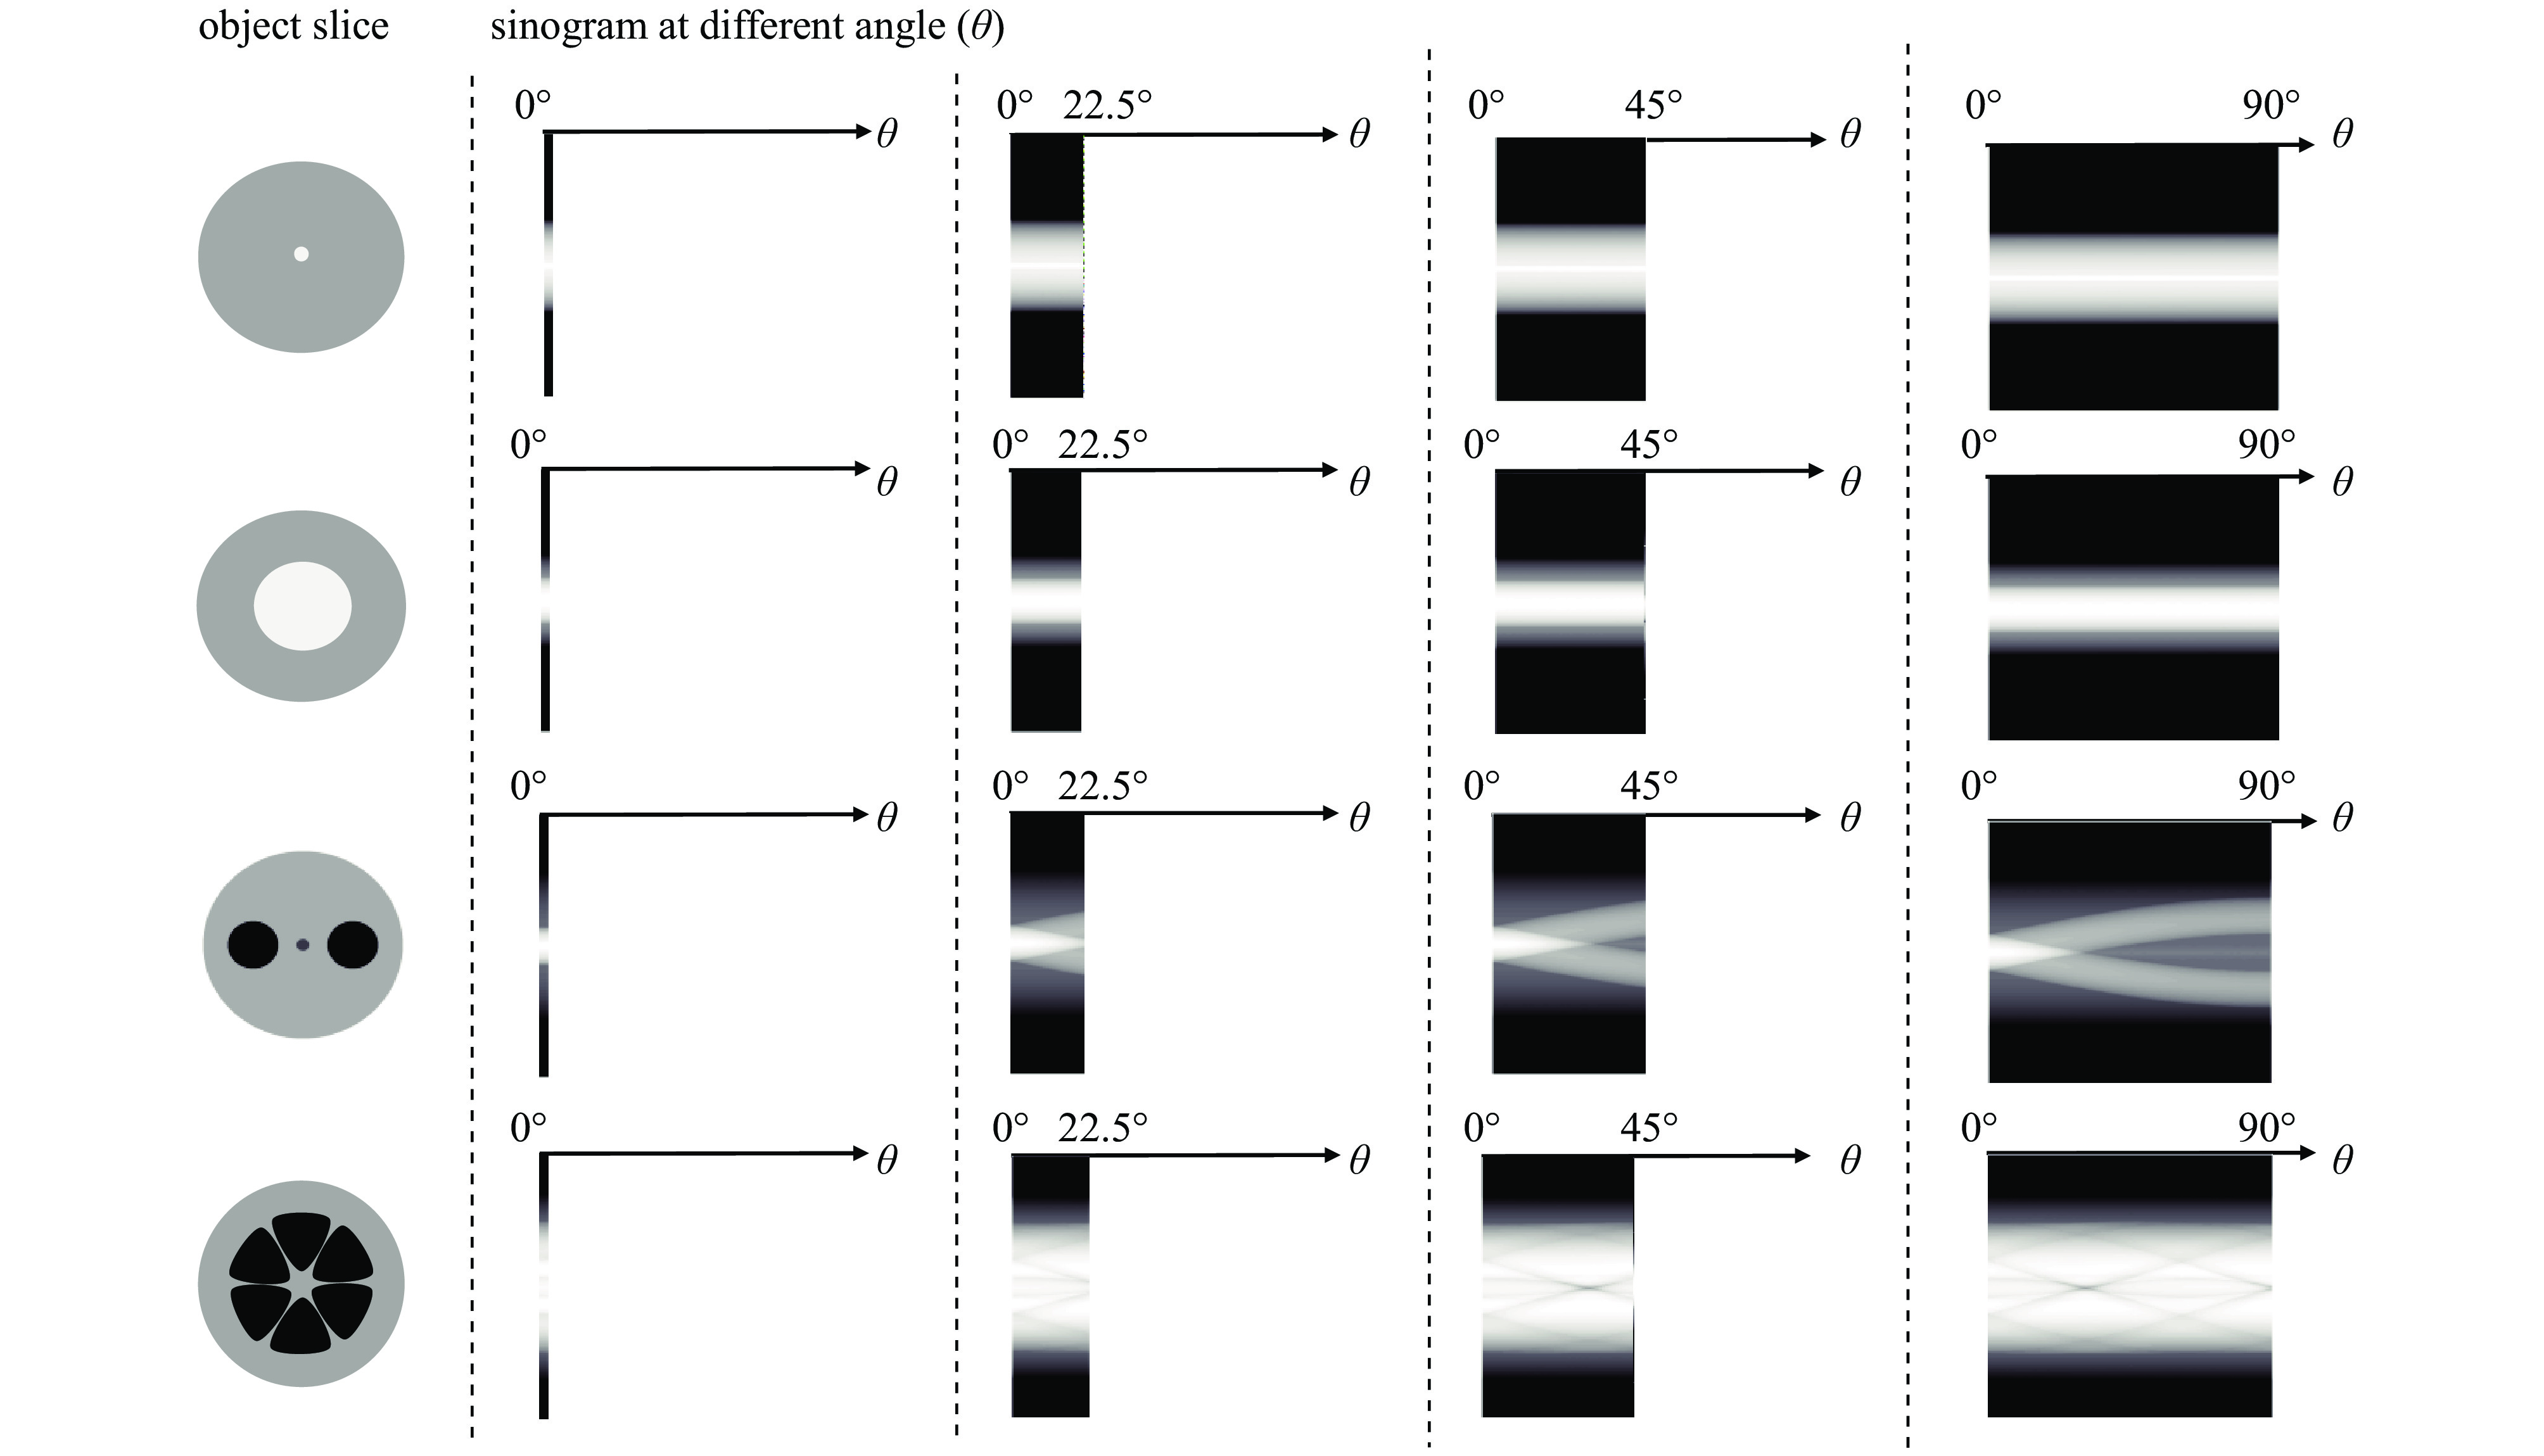
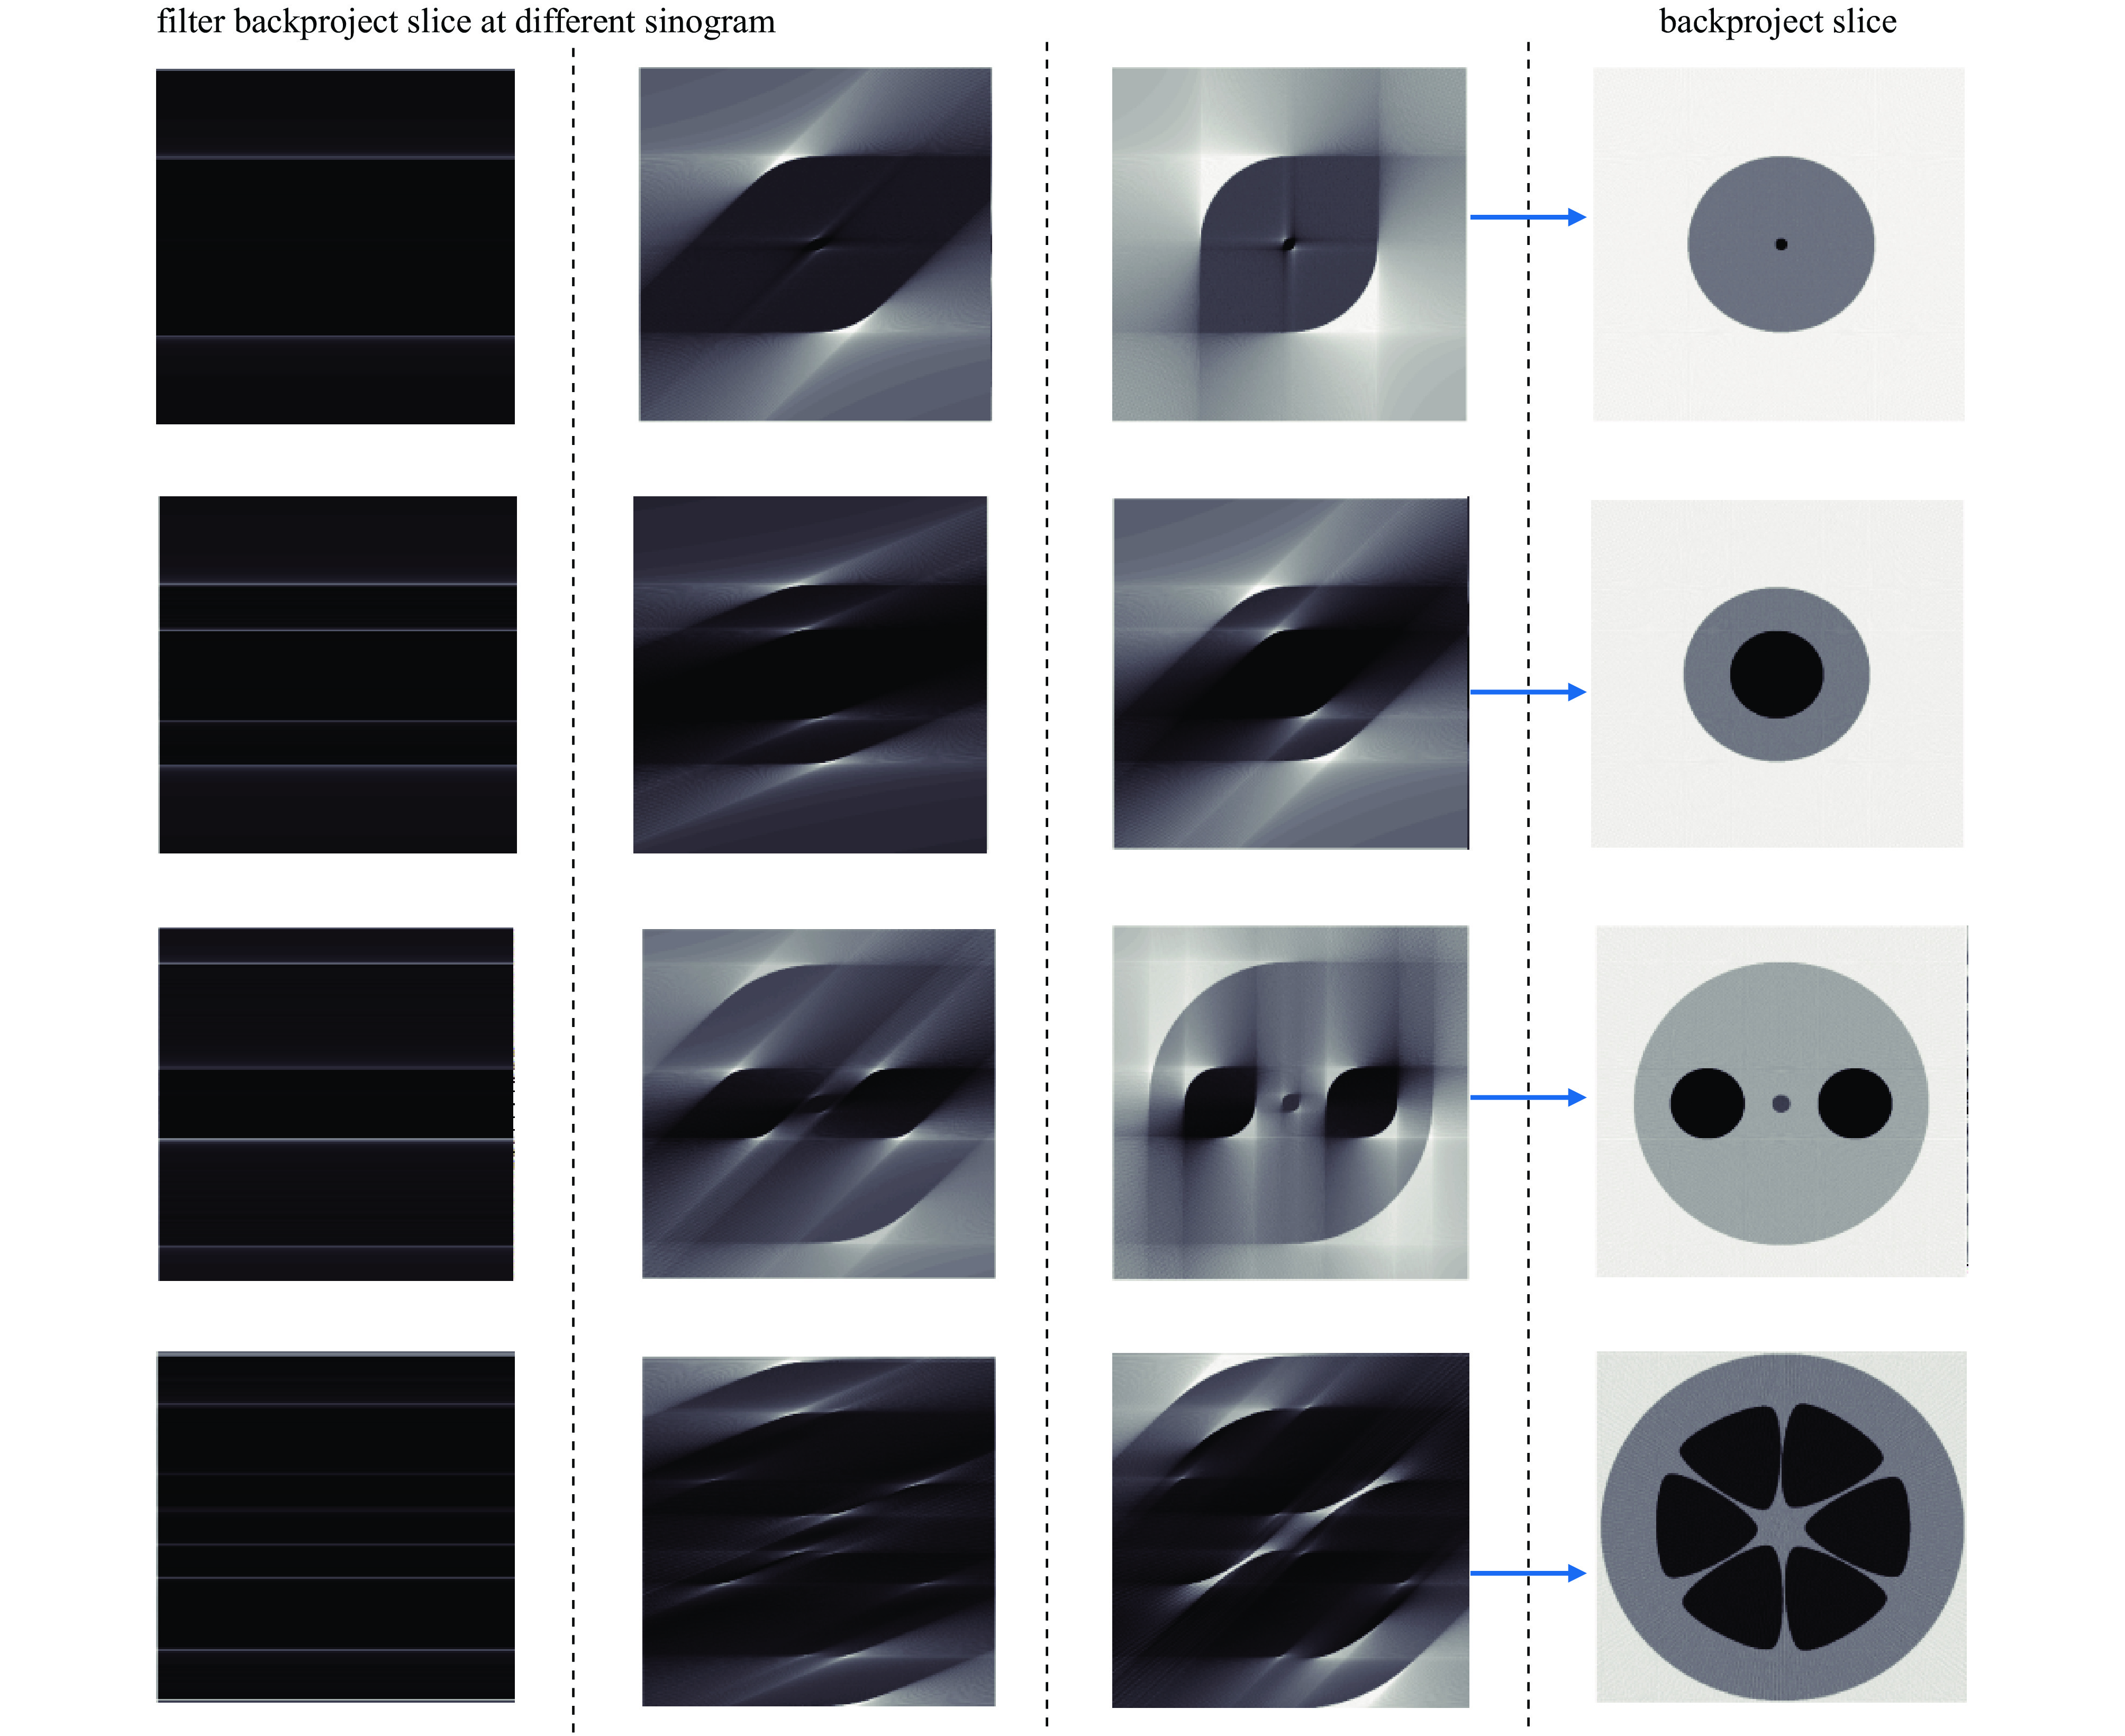
图2中,选用了单模光纤、多模光纤、熊猫型保偏光纤和柚子型光子晶体光纤作为样品,对于给定的物体旋转角θ=0o,22.5o,45o,90o,仿真模拟出了投影方向积分。若设定z=1且Δθ=1°,随物体的旋转,可以得到投影方向积分二维图,如图2所示。图3显示了对应角度下的正弦图,其中单模光纤和多模光纤显示了直线结构,这是由于普通单模和多模光纤具有旋转对称特性。
 图 2 单模光纤、多模光纤、熊猫型保偏光纤和柚子型光子晶体光纤在θ=0o,22.5o,45o,90o时的仿真投影积分Figure 2. Simulation projection integrals of single-mode fiber, multi-mode fiber, panda-type polarization-maintaining fiber and grapefruit-type photonic crystal fiber at θ=0o, 22.5o, 45o, 90o
 图 3 单模光纤、多模光纤、熊猫型保偏光纤和柚子型光子晶体光纤在不同投影数量和角度下的正弦图Figure 3. Sinograms of single-mode fiber, multi-mode fiber, panda-type PM fiber, and grapefruit-type photonic crystal fiber at different numbers of projections and angles
1.2 折射率提取原理
要想准确地重建光纤的三维折射率,就需要从干涉图中准确地提取出相位分布[31-34]。在此采用基于快速傅里叶变换的相位提取方法。首先,采集到干涉图之后对它进行频域滤波,再在频域中选择合适的窗口提取正一级频谱;然后,基于标量衍射的菲涅尔积分公式,数值再现物光波的复振幅分布。本试验中,光纤刚好在CMOS的接收面上成像,不需要再进行衍射计算。
将被测光纤置于比色皿中,光轴在x轴方向。当光纤绕其光轴旋转角度θ,分别测出参考状态和加入光纤样品后的干涉图,通过快速傅里叶变换,提取正一级频谱分别为C1(θ,fx−f0x,fy−f0y)和C2(θ,fx−f0x,fy−f0y),再进行傅里叶逆变换就可以得到c1(θ,x,y)和c2(θ,x,y),再根据式(4)可得待测的投影截断相位
Δφp0(θ,x,y)=arctan{Im[c2(θ,x,y)]Re[c2(θ,x,y)]}−arctan{Im[c1(θ,x,y)]Re[c1(θ,x,y)]}±2kπ , k=0,1,2,⋯⋯ (4) 对其进行相位展开,便能恢复投影相位变化Δφp(θ,x,y),此相位为被测光纤在绕光轴旋转角θ下的相位差投影积分。抽取x=x0时的二维投影数据Δφp(θ,x0,y),可得到对应的正弦图,对其进行滤波反投影就可以得到x=x0横断面的相位差的二维分布
Δφ(0,x0,y,z)=∫2π0∫∞−∞P(θ,x0,w)|w|exp[j2πw(zcosθ+ysinθ)]dwdθ (5) 式中:P(θ,x0,w)为Δφp(θ,x0,y)的傅里叶变换;w为空间频率。
利用式(5)的相位差分布,便可得到折射率分布
nθ = 0(x0,y,z)=λ2π Δφ(0,x0,y,z)+n0 (6) 对图3中的正弦图进行反投影重建,可以得到相位分布,再根据式(6)便可算出折射率分布,如图4所示。对每一个x0位置进行上述操作,就可获得光纤折射率的三维分布nθ=0 (x,y,z)。折射率测量的空间分辨率主要取决于数据采集的步进角度Δθ、显微镜成像质量和CMOS的分辨率。Δθ越小,采集得到的相位数据越多,重构的空间分辨率越高。
 图 4 根据图3中正弦图反投影出的光纤折射率分布Figure 4. Refractive index distribution of the fiber according to the back-projection of the sinogram in Fig. 3
2. 结果与讨论
由于光路中的各种光学元件都不可避免产生附加相位,为了得到准确的相位分布,需要对相位进行校正。保持光路中其他所有结构不变,分别记录无光纤和有光纤样品时的干涉图,计算这两幅干涉图的相位分布,并利用其相位分布相减的方法消除附加相位。此外,由于本试验的共光路设计,成像过程中的物光路与参考光路经过的光学元件完全相同,可以有效减少显微镜曲率不匹配等造成像场弯曲和倾斜的问题,提高干涉图的质量。单模光纤和多模光纤的干涉图如图5(a)和图5(d)所示。由上述提取相位、相位解包裹以及相位分布相减处理后的单模光纤的相位分布如图5(b)所示,它的三维形式如图5(c)所示。从图中看到,虽然大部分的附加相位已经得到校正,但重构的相位仍存在轻微的不对称。为了解决不对称引起的测量误差,将沿相位图中心轴左半边相位镜像复制到右边,把原本相位图右边的相位分布镜像复制到左边,最后将两个相位分布进行平均处理。取此相位分布中的任一列模拟不同角度下的相位数据,得到的光纤其截面折射率分布如图6(b)所示,图6(a)为沿截面直径方向的折射率分布。
 图 5 单模光纤、多模光纤的干涉图、相位分布和三维显示Figure 5. Interferogram, phase distribution 3D display of single-mode and multi-mode fibers
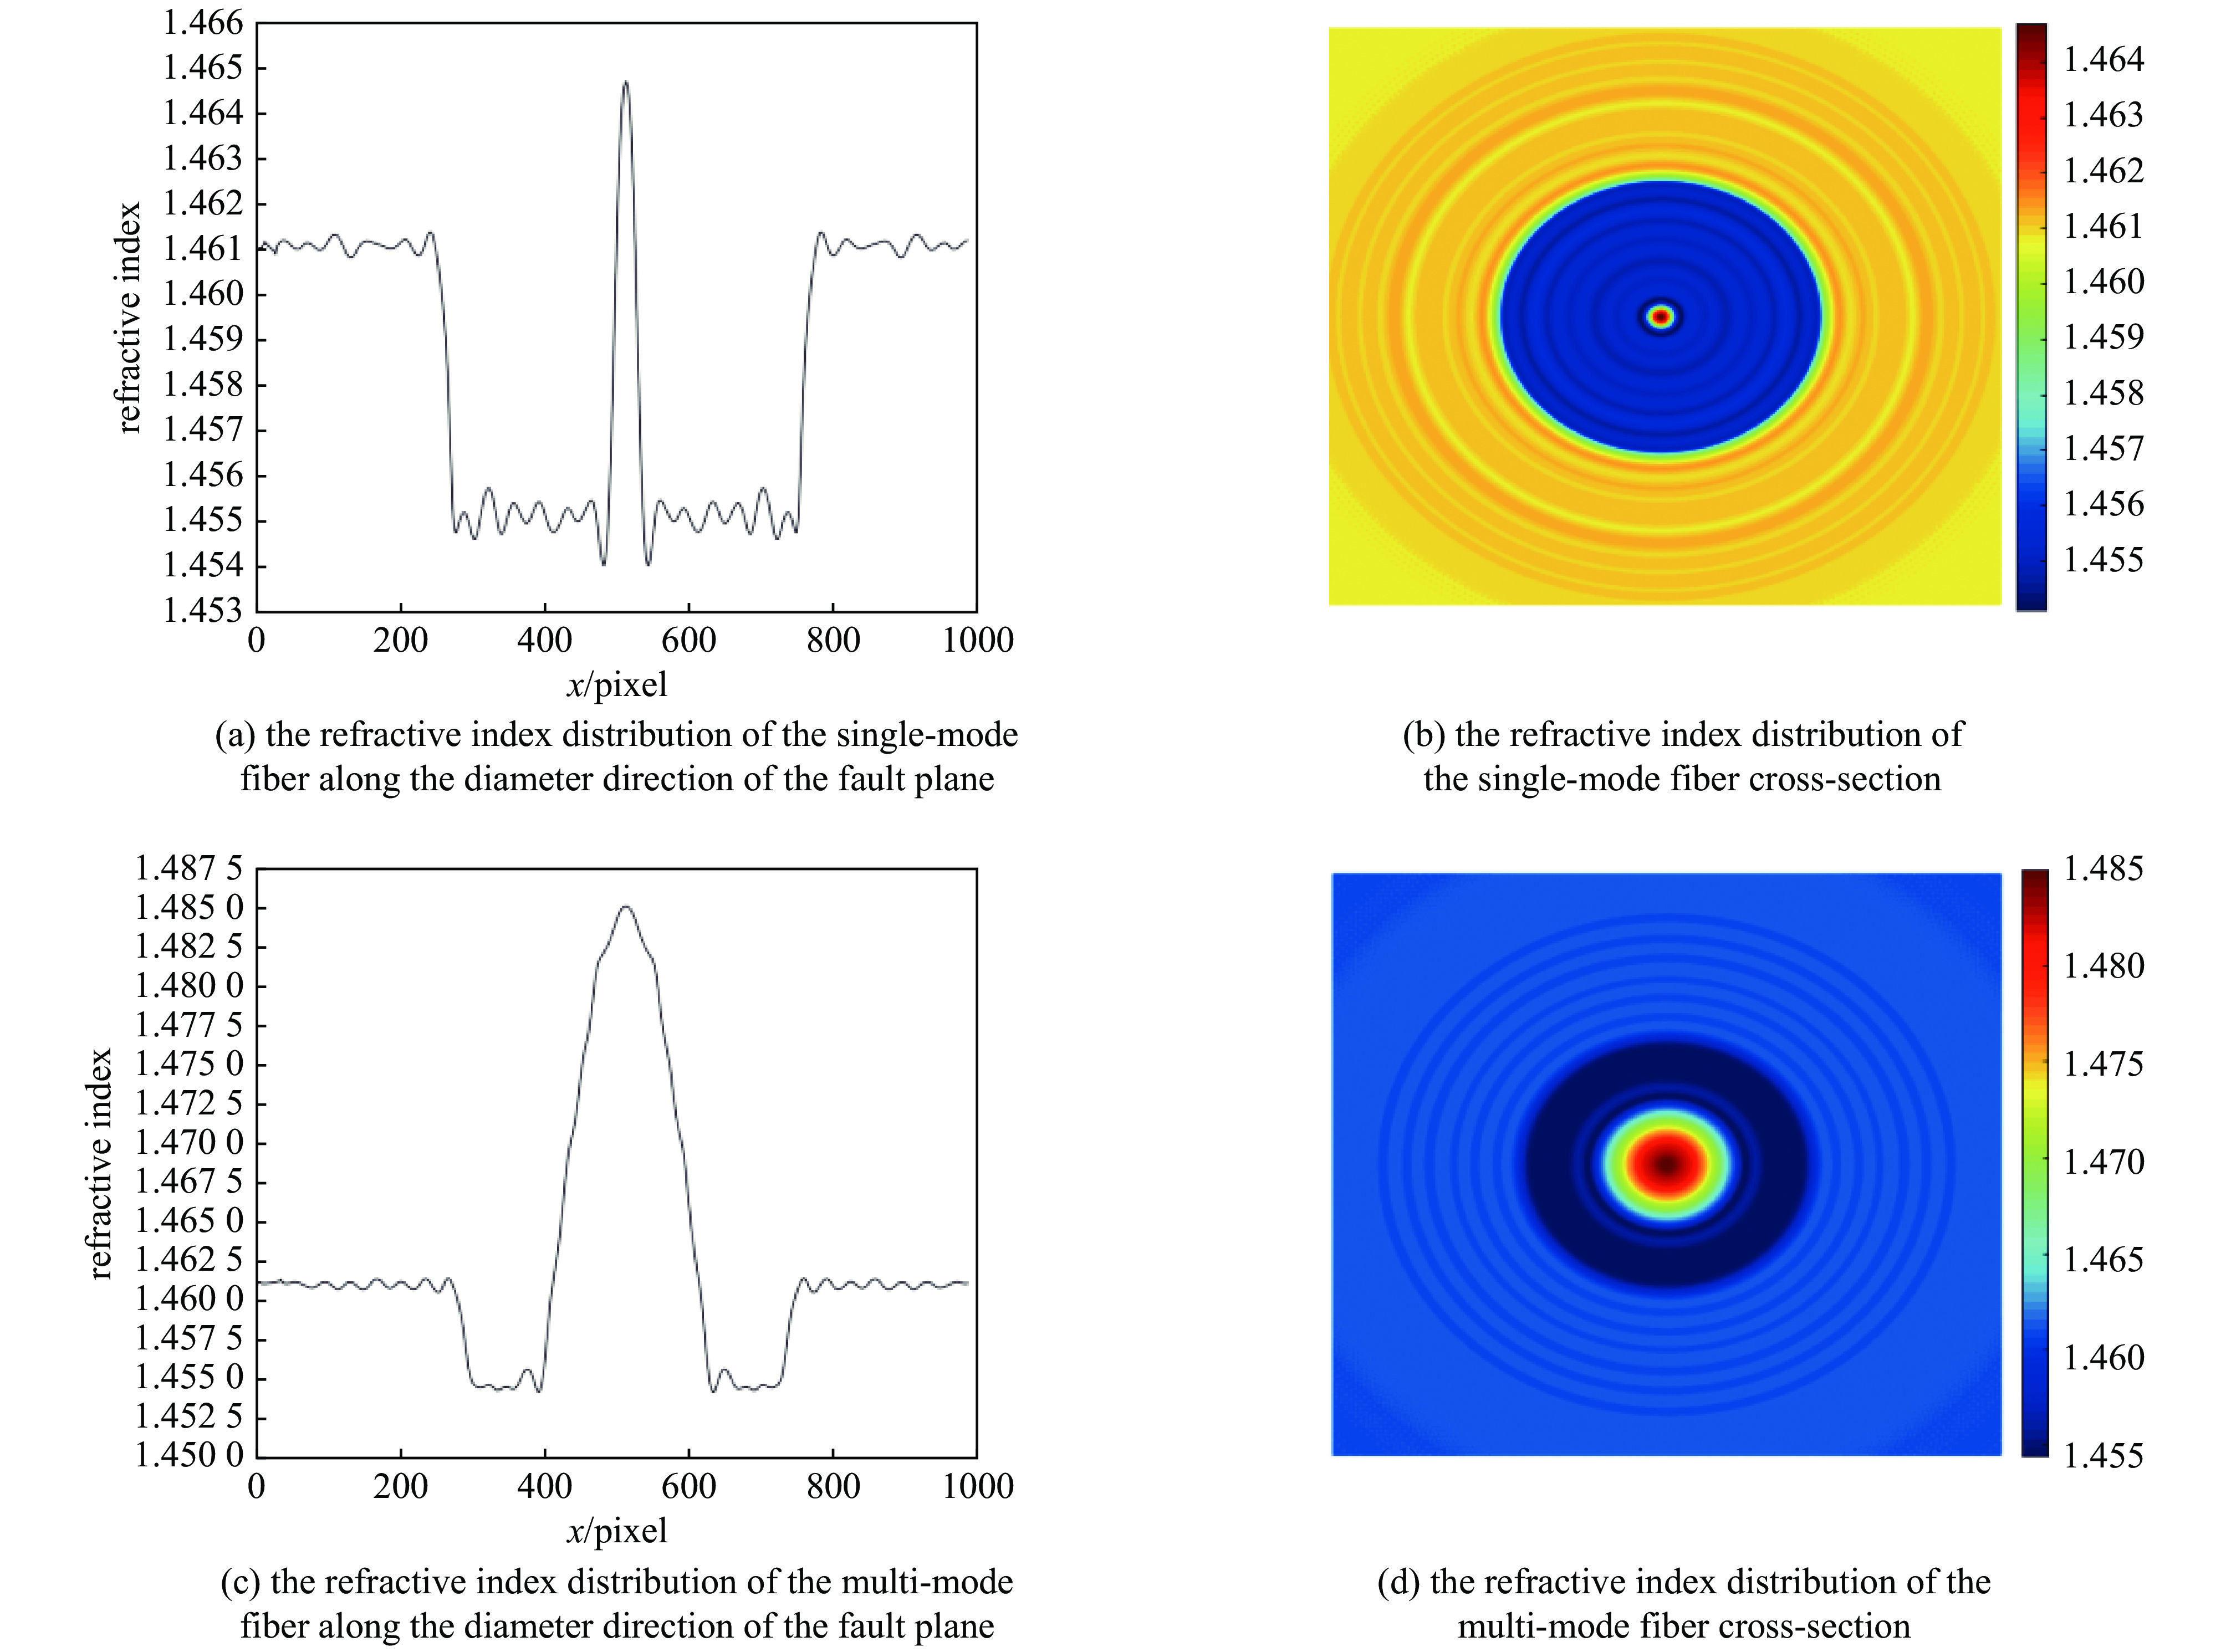
 图 6 单模光纤、多模光纤沿断层面直径方向和横截面的折射率分布Figure 6. Refractive index distribution of the single-mode fiber and multi-mode fiber along the diameter direction and cross-section of the fault plane
图6(a)的折射率分布符合单模光纤的结构。中间折射率稍高的为纤芯部分,两边稍低的为光纤包层,最外层折射率分布相对均匀的为匹配液。经过计算,包层的折射率为1.455 2,纤芯的折射率为1.460 8,相对折射率差为0.38%。根据上述原理和步骤,测量了多模光纤(FiberHome MMF 62.5/125 μm)的相位分布和折射率分布。图5(e)为多模光纤的相位分布,图5(f)为图5(e)的三维显示,图6(d)是多模光纤横截面的折射率分布,图6(c)是该截面上沿径向的折射率分布。多模光纤的纤芯直径为裸光纤直径的一半,这也很好地体现在图6中。根据图6(c)的折射率分布,计算可得包层和纤芯的折射率为1.455 7和1.473 7,相对折射率差为1.22%。
3. 结 论
针对光纤内部折射率分布的检测,提出了基于单元件干涉仪的计算机断层扫描光路系统。基于显微成像原理,提高了横向分辨率,无需进行衍射传输计算。通过快速傅里叶方法提取相位,用减去参考相位的方法消除了大部分的附加相位,通过滤波反投影算法和光纤的圆柱对称结构对光纤的内部折射率进行了重建。试验以单模和多模光纤进行了测量,结果符合光纤折射率实际分布的情况。整个系统结构简单紧凑,稳定性强,易于实现,可为计算机断层扫描系统的小型化提供一定的参考。
-

图 1 基于单元件干涉的显微断层成像的光纤折射率测量
Figure 1. Optical fiber refractive index measurement of micro tomography based on unit interference
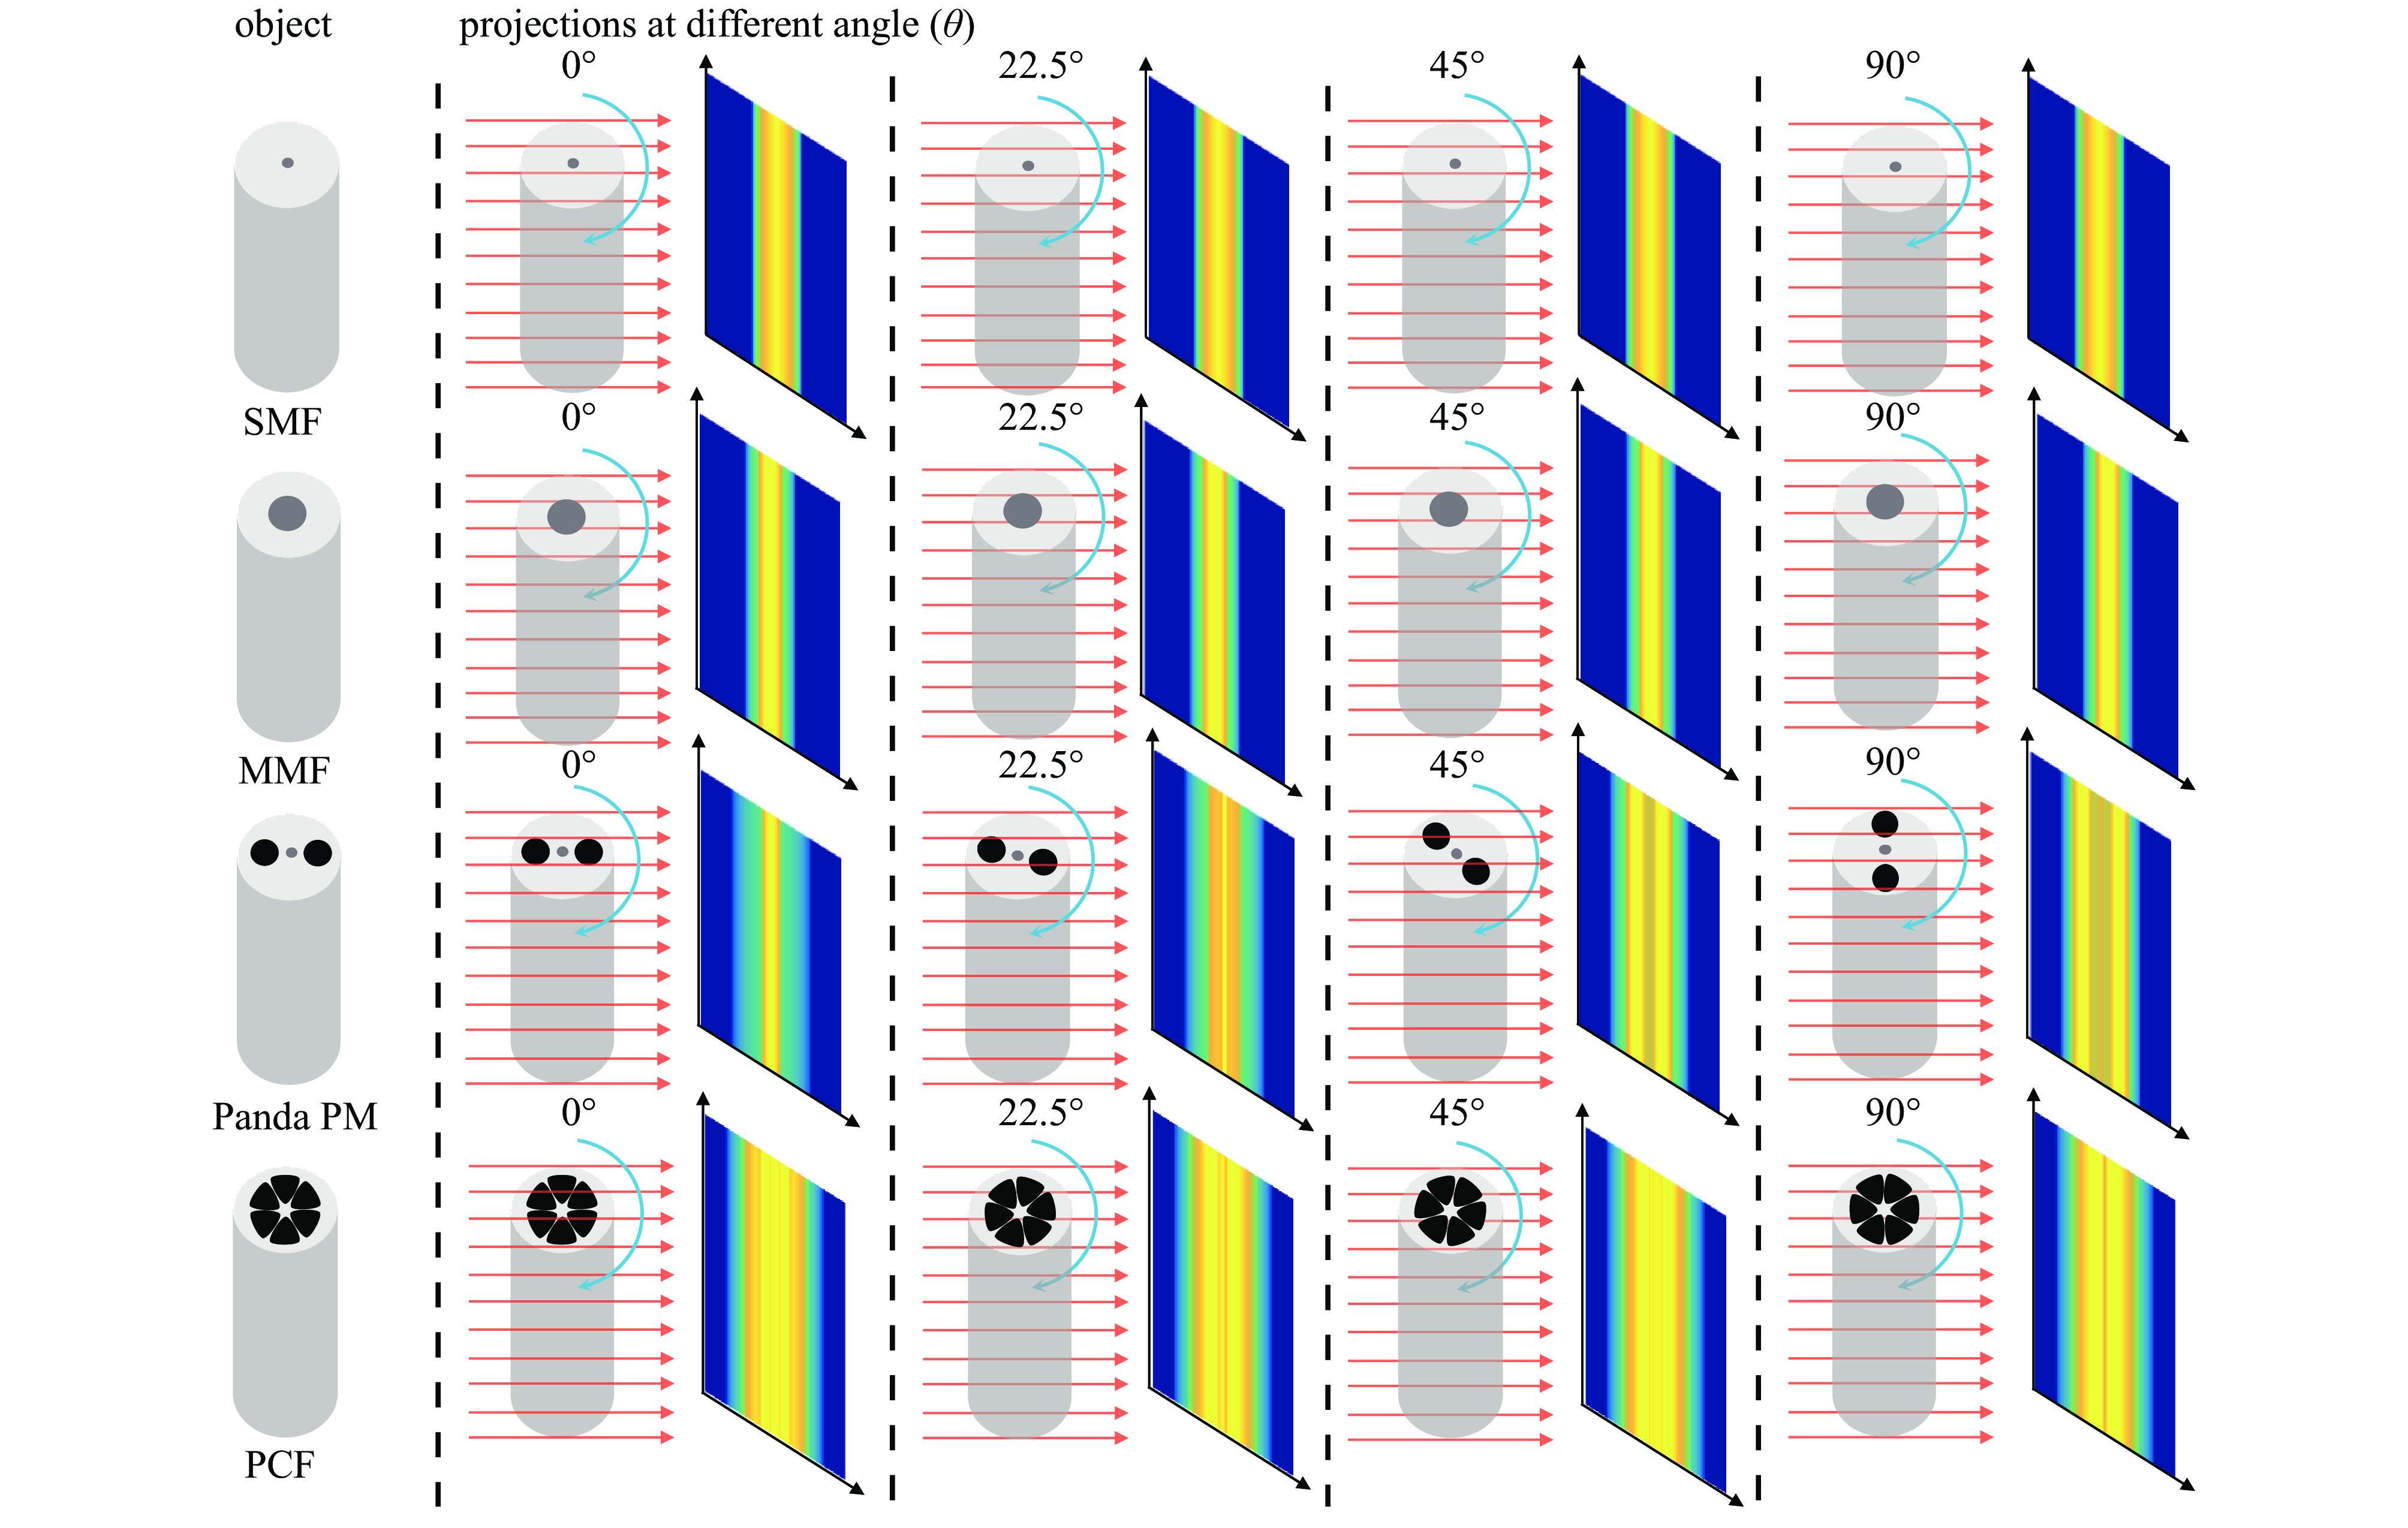
图 2 单模光纤、多模光纤、熊猫型保偏光纤和柚子型光子晶体光纤在θ=0o,22.5o,45o,90o时的仿真投影积分
Figure 2. Simulation projection integrals of single-mode fiber, multi-mode fiber, panda-type polarization-maintaining fiber and grapefruit-type photonic crystal fiber at θ=0o, 22.5o, 45o, 90o

图 3 单模光纤、多模光纤、熊猫型保偏光纤和柚子型光子晶体光纤在不同投影数量和角度下的正弦图
Figure 3. Sinograms of single-mode fiber, multi-mode fiber, panda-type PM fiber, and grapefruit-type photonic crystal fiber at different numbers of projections and angles

图 4 根据图3中正弦图反投影出的光纤折射率分布
Figure 4. Refractive index distribution of the fiber according to the back-projection of the sinogram in Fig. 3
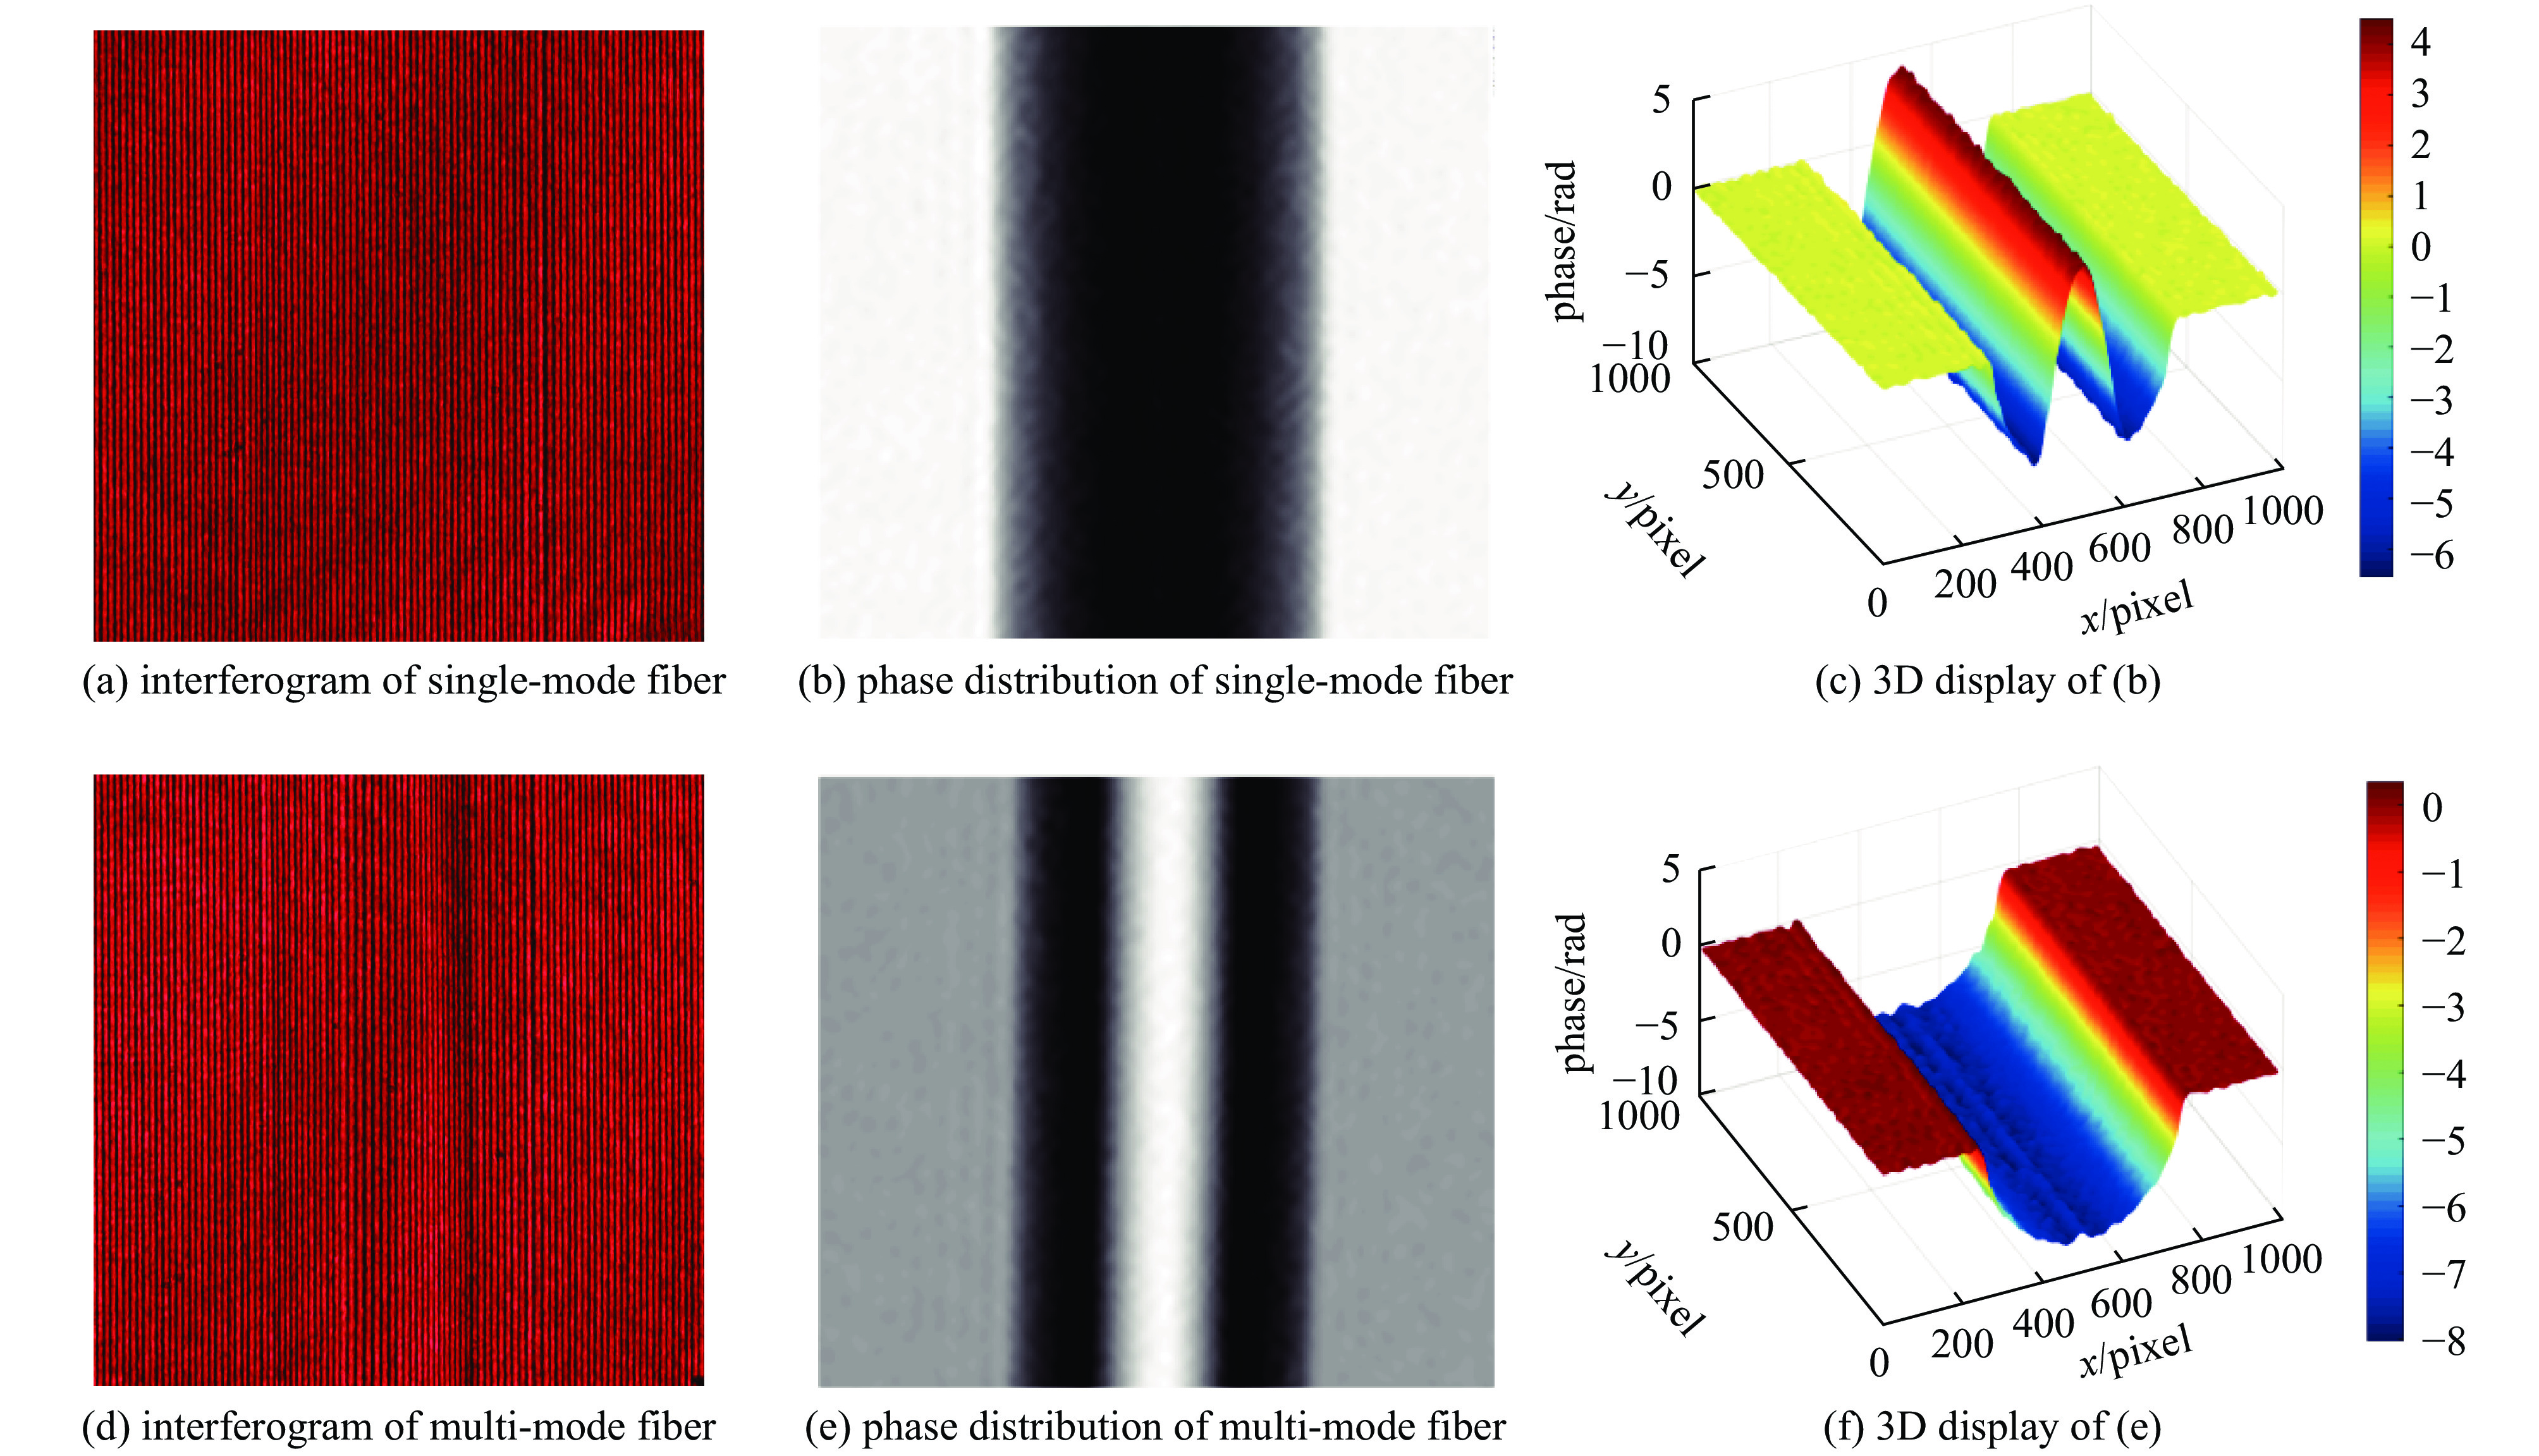
图 5 单模光纤、多模光纤的干涉图、相位分布和三维显示
Figure 5. Interferogram, phase distribution 3D display of single-mode and multi-mode fibers
-
[1] Zhu Yongkai, Tian Guiyun, Lu Rongsheng, et al. A review of optical NDT technologies[J]. Sensors, 2011, 11(8): 7773-7798. doi: 10.3390/s110807773 [2] Jing Jianying, Liu Kun, Jiang Junfeng, et al. Performance improvement approaches for optical fiber SPR sensors and their sensing applications[J]. Photonics Research, 2022, 10(1): 126-147. doi: 10.1364/PRJ.439861 [3] Zhu Zongda, Ba Dexin, Liu Lu, et al. Temperature-compensated distributed refractive index sensor based on an etched multi-core fiber in optical frequency domain reflectometry[J]. Optics Letters, 2021, 46(17): 4308-4311. doi: 10.1364/OL.432405 [4] Bachim B L, Gaylord T K. Microinterferometric optical phase tomography for measuring small, asymmetric refractive-index differences in the profiles of optical fibers and fiber devices[J]. Applied Optics, 2005, 44(3): 316-327. doi: 10.1364/AO.44.000316 [5] Pace P, Huntington S T, Lyytikäinen K, et al. Refractive index profiles of Ge-doped optical fibers with nanometer spatial resolution using atomic force microscopy[J]. Optics Express, 2004, 12(7): 1452-1457. doi: 10.1364/OPEX.12.001452 [6] Poumellec B, Guenot P, Nadjo R, et al. Information obtained from the surface profile of a cut single-mode fiber[J]. Journal of Lightwave Technology, 1999, 17(8): 1357-1365. doi: 10.1109/50.779157 [7] Fontaine N H, Young M. Two-dimensional index profiling of fibers and waveguides[J]. Applied Optics, 1999, 38(33): 6836-6844. doi: 10.1364/AO.38.006836 [8] Pan Zhelang, Liang Zhiqiang, Li Shiping, et al. Microtomography of the polarization-maintaining fiber by digital holography[J]. Optical Fiber Technology, 2015, 22: 46-51. doi: 10.1016/j.yofte.2015.01.003 [9] Pan Feng, Deng Yating, Ma Xichao, et al. Measurement of spatial refractive index distributions of fusion spliced optical fibers by digital holographic microtomography[J]. Optics Communications, 2017, 403: 370-375. doi: 10.1016/j.optcom.2017.05.045 [10] Withers P J, Bouman C, Carmignato S, et al. X-ray computed tomography[J]. Nature Reviews Methods Primers, 2021, 1: 18. doi: 10.1038/s43586-021-00015-4 [11] Pillon J, Collignon M, Rattier M, et al. Three-dimensional topological reconstruction of the sensing coil of a fiber-optic gyroscope using X-ray computed tomography[J]. Journal of Lightwave Technology, 2021, 39(14): 4861-4872. doi: 10.1109/JLT.2021.3068605 [12] Lin Y C, Chen Huichi, Tu H Y, et al. Optically driven full-angle sample rotation for tomographic imaging in digital holographic microscopy[J]. Optics Letters, 2017, 42(7): 1321-1324. doi: 10.1364/OL.42.001321 [13] Levine Z H, Garboczi E J, Peskin A P, et al. X-ray computed tomography using partially coherent Fresnel diffraction with application to an optical fiber[J]. Optics Express, 2021, 29(2): 1788-1804. doi: 10.1364/OE.414398 [14] Frank S, Seiler M, Bliedtner J. Three-dimensional evaluation of subsurface damage in optical glasses with ground and polished surfaces using FF-OCT[J]. Applied Optics, 2021, 60(8): 2118-2126. doi: 10.1364/AO.413090 [15] Zeleznik R, Foldyna B, Eslami P, et al. Deep convolutional neural networks to predict cardiovascular risk from computed tomography[J]. Nature Communications, 2021, 12: 715. doi: 10.1038/s41467-021-20966-2 [16] Kim G, Lee S, Shin S, et al. Three-dimensional label-free imaging and analysis of Pinus pollen grains using optical diffraction tomography[J]. Scientific Reports, 2018, 8: 1782. doi: 10.1038/s41598-018-20113-w [17] Wahba H H, Kreis T. Characterization of graded index optical fibers by digital holographic interferometry[J]. Applied Optics, 2009, 48(8): 1573-1582. doi: 10.1364/AO.48.001573 [18] 潘哲朗, 李仕萍, 钟金钢. 用数字全息层析成像技术测量毛细管的内径及壁厚[J]. 光学 精密工程, 2013, 21(7):1643-1650. (Pan Zhelang, Li Shiping, Zhong Jin’gang. Measurement of inner diameter and wall thickness for micro-capillary by digital holographic tomography[J]. Optics and Precision Engineering, 2013, 21(7): 1643-1650 doi: 10.3788/OPE.20132107.1643 [19] 苏玲珑, 马利红, 王辉, 等. 基于数字全息显微断层成像的光纤折射率三维定量测量[J]. 中国激光, 2013, 40:1008002. (Su Linglong, Ma Lihong, Wang Hui, et al. Three-dimensional refractive index quantitative measurement for optical fiber by digital holographic tomography[J]. Chinese Journal of Lasers, 2013, 40: 1008002 doi: 10.3788/CJL201340.1008002 [20] Wahba H H. Reconstruction of 3D refractive index profiles of PM PANDA optical fiber using digital holographic method[J]. Optical Fiber Technology, 2014, 20(5): 520-526. doi: 10.1016/j.yofte.2014.06.002 [21] Hamza A A, Sokkar T Z N, El-Farahaty K A, et al. A proposed method to reconstruct the three-dimensional dispersion profile of polymeric fibres based on variable wavelength interferometry[J]. Journal of Microscopy, 2015, 257(2): 123-132. doi: 10.1111/jmi.12191 [22] 谷婷婷, 黄素娟, 闫成, 等. 基于数字全息图的光纤折射率测量研究[J]. 物理学报, 2015, 64:064204. (Gu Tingting, Huang Sujuan, Yan Cheng, et al. Refractive index measurement research for optical fiber based on digital hologram[J]. Acta Physica Sinica, 2015, 64: 064204 doi: 10.7498/aps.64.064204 [23] 黄素娟, 曾俊璋, 闫成, 等. 扭转保偏光纤的三维折射率测量[J]. 光子学报, 2017, 46:0612001. (Huang Sujuan, Zeng Junzhang, Yan Cheng, et al. 3D refractive index measurement for spun polarization-maintaining optical fiber[J]. Acta Photonica Sinica, 2017, 46: 0612001 doi: 10.3788/gzxb20174606.0612001 [24] Wang Weiping, Huang Sujuan, Chen Yi, et al. Three-dimensional refractive index measurement of special optical fiber based on optical vortex phase-shifting digital holographic microscopy[J]. Optical Engineering, 2019, 58: 034108. [25] Sung Y, Yoshida S, Kato Y, et al. Three-dimensional densification measurement of Vickers-indented glass using digital holographic tomography[J]. Journal of the American Ceramic Society, 2019, 102(10): 5866-5872. doi: 10.1111/jace.16508 [26] Yassien K M, Agour M, El-Bakary M A. Determination of physical properties of irradiated PTFE fibers using digital holographic microscopy[J]. Applied Physics B, 2019, 125: 180. [27] Omar E Z. Adaptive demodulation for phase information and opto-mechanical properties of fibres from blurred digital holography pattern[J]. Optical and Quantum Electronics, 2022, 54: 31. doi: 10.1007/s11082-021-03403-y [28] Raslan M I, Sokkar T Z N, Hamza A A. An algorithm for direct birefringence measurements using intensities of digital photoelastic patterns of fibres[J]. Applied Physics B, 2022, 128: 5. [29] Zhang Tao, Feng Guoying, Song Zheyi, et al. A single-element interferometer for measuring refractive index of transparent liquids[J]. Optics Communications, 2014, 332: 14-17. doi: 10.1016/j.optcom.2014.06.028 [30] Lan Bin, Feng Guoying, Zhang Tao, et al. Dynamic measurement of 2D refractive index distribution of NaCl solutions[J]. Journal of Modern Optics, 2017, 64(1): 8-16. doi: 10.1080/09500340.2016.1205227 [31] Takeda M, Ina H, Kobayashi S. Fourier-transform method of fringe-pattern analysis for computer-based topography and interferometry[J]. Journal of the Optical Society of America, 1982, 72(1): 156-160. doi: 10.1364/JOSA.72.000156 [32] Lan Bin, Feng Guoying, Dong Zheliang, et al. A carrier removal method based on frequency domain self-filtering for interferogram analysis[J]. Optik, 2016, 127(15): 5961-5967. doi: 10.1016/j.ijleo.2016.04.008 [33] Lan Bin, Feng Guoying, Zhang Tao, et al. Phase demodulation from a spatial carrier fringe pattern by spatial-temporal fringes method[J]. Journal of Optics, 2016, 18: 125704. doi: 10.1088/2040-8978/18/12/125704 [34] Lan Bin, Feng Guoying, Zhang Tao, et al. Accurate carrier-removal method for interferogram analysis[J]. Optical Engineering, 2017, 56: 034101. doi: 10.1117/1.OE.56.3.034101 期刊类型引用(1)
1. 解翔宇,王鹏,邓颖,周凯南,冯国英. 单元件干涉数字全息的光线追迹模型. 强激光与粒子束. 2023(05): 163-170 .  本站查看
本站查看其他类型引用(1)
-

 下载:
下载:


 下载:
下载:

 点击查看大图
计量
- 文章访问数: 795
- HTML全文浏览量: 357
- PDF下载量: 50
- 被引次数: 2
